Update (August 2019): the technique described below, in particular how to schedule an event to fire after style/layout calculations are complete, is now captured in a web API proposal called requestPostAnimationFrame. There is also a good polyfill called afterframe.
Update (October 2022): in 2019, WebKit updated their requestAnimationFrame implementation to align with Chrome and Firefox (i.e. rendering before the next frame).
We all want to make faster websites. The question is just what to measure, and how to use that information to determine what’s “slow” and what could be made faster.
The browser rendering pipeline is complicated. For that reason, it’s tricky to measure the performance of a webpage, especially when components are rendered client-side and everything becomes an intricate ballet between JavaScript, the DOM, styling, layout, and rendering. Many folks stick to what they understand, and so they may under-measure or completely mis-measure their website’s frontend performance.
So in this post, I want to demystify some of these concepts, and offer techniques for accurately measuring what’s going on when we render things on the web.
The web rendering pipeline
Let’s say we have a component that is rendered client-side, using JavaScript. To keep things simple, I wrote a demo component in vanilla JS, but everything I’m about to say would also apply to React, Vue, Angular, etc.
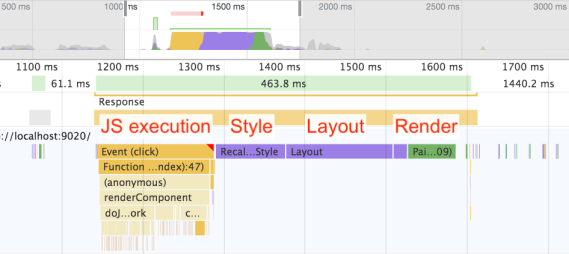
When we use the handy Performance profiler in the Chrome Dev Tools, we see something like this:
This is a view of the CPU costs of our component, in terms of milliseconds on the UI thread. To break things down, here are the steps required:
- Execute JavaScript – executing (but not necessarily compiling) JavaScript, including any state manipulation, “virtual DOM diffing,” and modifying the DOM.
- Calculate style – taking a CSS stylesheet and matching its selector rules with elements in the DOM. This is also known as “formatting.”
- Calculate layout – taking those CSS styles we calculated in step #2 and figuring out where the boxes should be laid out on the screen. This is also known as “reflow.”
- Render – the process of actually putting pixels on the screen. This often involves painting, compositing, GPU acceleration, and a separate rendering thread.
All of these steps invoke CPU costs, and therefore all of them can impact the user experience. If any one of them takes a long time, it can lead to the appearance of a slow-loading component.
The naïve approach
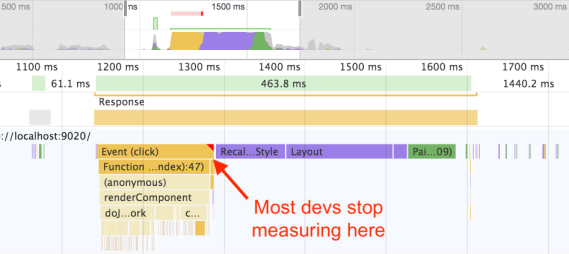
Now, the most common mistake that folks make when trying to measure this process is to skip steps 2, 3, and 4 entirely. In other words, they just measure the time spent executing JavaScript, and completely ignore everything after that.
When I worked as a browser performance engineer, I would often look at a trace of a team’s website and ask them which mark they used to measure “done.” More often than not, it turned out that their mark landed right after JavaScript, but before style and layout, meaning the last bit of CPU work wasn’t being measured.
So how do we measure these costs? For the purposes of this post, let’s focus on how we measure style and layout in particular. As it turns out, the render step is much more complicated to measure, and indeed it’s impossible to measure accurately, because rendering is often a complex interplay between separate threads and the GPU, and therefore isn’t even visible to userland JavaScript running on the main thread.
Style and layout calculations, however, are 100% measurable because they block the main thread. And yes, this is true even with something like Firefox’s Stylo engine – even if multiple threads can be employed to speed up the work, ultimately the main thread has to wait on all the other threads to deliver the final result. This is just the way the web works, as specc’ed.
What to measure
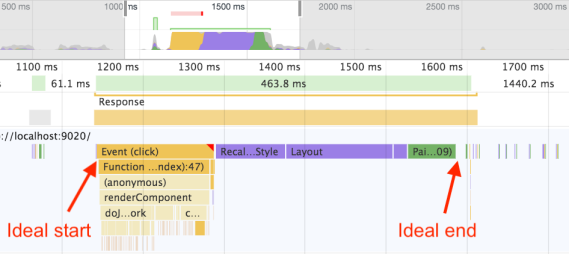
So in practical terms, we want to put a performance mark before our JavaScript starts executing, and another one after all the additional work is done:
I’ve written previously about various JavaScript timers on the web. Can any of these help us out?
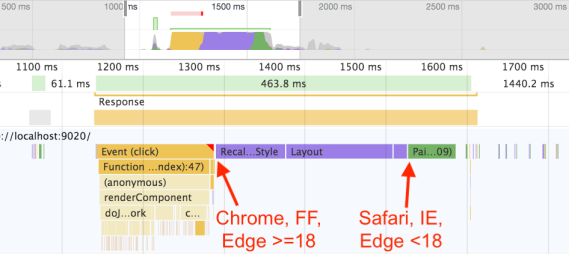
As it turns out, requestAnimationFrame will be our main tool of choice, but there’s a problem. As Jake Archibald explains in his excellent talk on the event loop, browsers disagree on where to fire this callback:
Now, per the HTML5 event loop spec, requestAnimationFrame is indeed supposed to fire before style and layout are calculated. Edge has already fixed this in v18, and perhaps Safari will fix it in the future as well. But that would still leave us with inconsistent behavior in IE, as well as in older versions of Safari and Edge.
Also, if anything, the spec-compliant behavior actually makes it more difficult to measure style and layout! In an ideal world, the spec would have two timers – one for requestAnimationFrame, and another for requestAnimationFrameAfterStyleAndLayout (or something like that). In fact, there has been some discussion at the WHATWG about adding an API for this, but so far it’s just a gleam in the spec authors’ eyes.
Unfortunately, we live in the real world with real constraints, and we can’t wait for browsers to add this timer. So we’ll just have to figure out how to crack this nut, even with browsers disagreeing on when requestAnimationFrame should fire. Is there any solution that will work cross-browser?
Cross-browser “after frame” callback
There’s no solution that will work perfectly to place a callback right after style and layout, but based on the advice of Todd Reifsteck, I believe this comes closest:
requestAnimationFrame(() => {
  setTimeout(() => {
    performance.mark('end')
  })
})
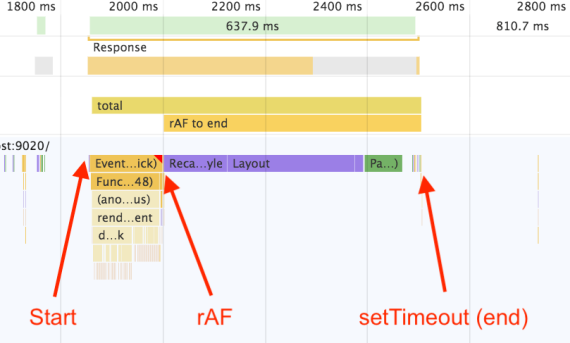
Let’s break down what this code is doing. In the case of spec-compliant browsers, such as Chrome, it looks like this:
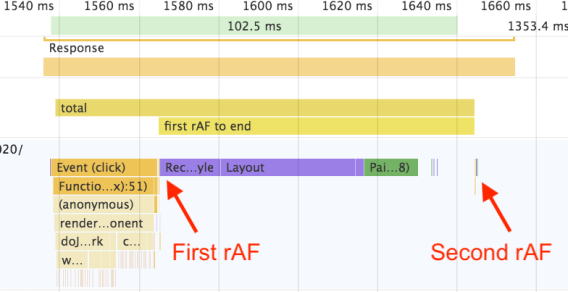
Note that rAF fires before style and layout, but the next setTimeout fires just after those steps (including “paint,” in this case).
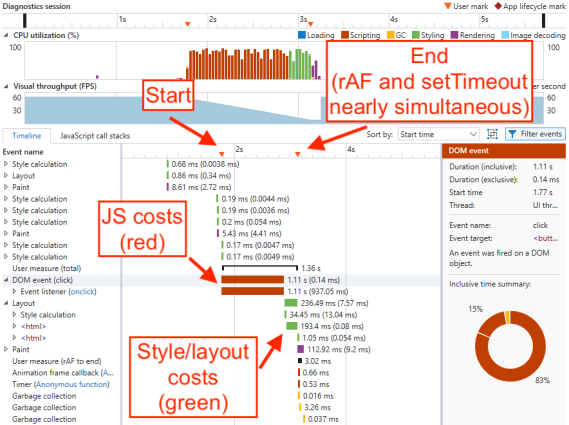
And here’s how it works in non-spec-compliant browsers, such as Edge 17:
Note that rAF fires after style and layout, and the next setTimeout happens so soon that the Edge F12 Tools actually render the two marks on top of each other.
So essentially, the trick is to queue a setTimeout callback inside of a rAF, which ensures that the second callback happens after style and layout, regardless of whether the browser is spec-compliant or not.
Downsides and alternatives
Now to be fair, there are a lot of problems with this technique:
setTimeoutis somewhat unpredictable in that it may be clamped to 4ms (or more in some cases).- If there are any other
setTimeoutcallbacks that have been queued elsewhere in the code, then ours may not be the last one to run. - In the non-spec-compliant browsers, doing the
setTimeoutis actually a waste, because we already have a perfectly good place to set our mark – right inside therAF!
However, if you’re looking for a one-size-fits-all solution for all browsers, rAF + setTimeout is about as close as you can get. Let’s consider some alternative approaches and why they wouldn’t work so well:
rAF + microtask
requestAnimationFrame(() => {
  Promise.resolve().then(() => {
    performance.mark('after')
  })
})
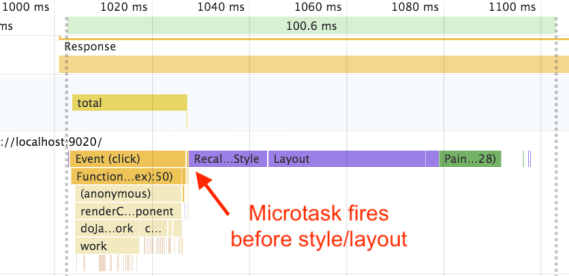
This one doesn’t work at all, because microtasks (e.g. Promises) run immediately after JavaScript execution has completed. So it doesn’t wait for style and layout at all:
rAF + requestIdleCallback
requestAnimationFrame(() => {
  requestIdleCallback(() => {
    performance.mark('after')
  })
})
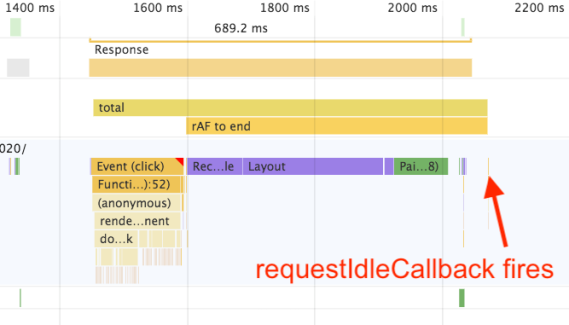
Calling requestIdleCallback from inside of a requestAnimationFrame will indeed capture style and layout:
However, if the microtask version fires too early, I would worry that this one would fire too late. The screenshot above shows it firing fairly quickly, but if the main thread is busy doing other work, rIC could be delayed a long time waiting for the browser to decide that it’s safe to run some “idle” work. This one is far less of a sure bet than setTimeout.
rAF + rAF
requestAnimationFrame(() => {
  requestAnimationFrame(() => {
    performance.mark('after')
  })
})
This one, also called a “double rAF,” is a perfectly fine solution, but compared to the setTimeout version, it probably captures more idle time – roughly 16.7ms on a 60Hz screen, as opposed to the standard 4ms for setTimeout – and is therefore slightly more inaccurate.
You might wonder about that, given that I’ve already talked about setTimeout(0) not really firing in 0 (or even necessarily 4) milliseconds in a previous blog post. But keep in mind that, even though setTimeout() may be clamped by as much as a second, this only occurs in a background tab. And if we’re running in a background tab, we can’t count on rAF at all, because it may be paused altogether. (How to deal with noisy telemetry from background tabs is an interesting but separate question.)
So rAF+setTimeout, despite its flaws, is probably still better than rAF+rAF.
Not fooling ourselves
In any case, whether we choose rAF+setTimeout or double rAF, we can rest assured that we’re capturing any event-loop-driven style and layout costs. With this measure in place, it’s much less likely that we’ll fool ourselves by only measuring JavaScript and direct DOM API performance.
As an example, let’s consider what would happen if our style and layout costs weren’t just invoked by the event loop – that is, if our component were calling one of the many APIs that force style/layout recalculation, such as getBoundingClientRect(), offsetTop, etc.
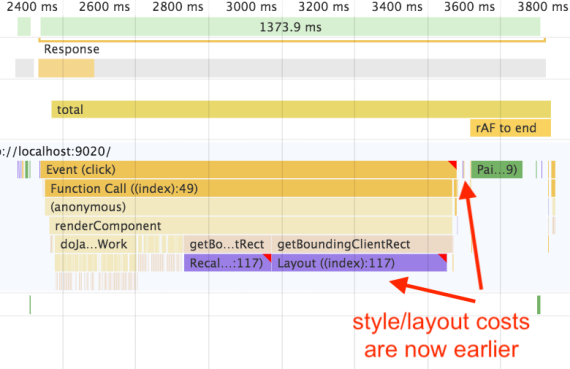
If we call getBoundingClientRect() just once, notice that the style and layout calculations shift over into the middle of JavaScript execution:
The important point here is that we’re not doing anything any slower or faster – we’ve merely moved the costs around. If we don’t measure the full costs of style and layout, though, we might deceive ourselves into thinking that calling getBoundingClientRect() is slower than not calling it! In fact, though, it’s just a case of robbing Peter to pay Paul.
It’s worth noting, though, that the Chrome Dev Tools have added little red triangles to our style/layout calculations, with the message “Forced reflow is a likely performance bottleneck.” This can be a bit misleading in this case, because again, the costs are not actually any higher – they’ve just moved to earlier in the trace.
(Now it’s true that, if we call getBoundingClientRect() repeatedly and change the DOM in the process, then we might invoke layout thrashing, in which case the overall costs would indeed be higher. So the Chrome Dev Tools are right to warn folks in that case.)
In any case, my point is that it’s easy to fool yourself if you only measure explicit JavaScript execution, and ignore any event-loop-driven style and layout costs that come afterward. The two costs may be scheduled differently, but they both impact performance.
Conclusion
Accurately measuring layout on the web is hard. There’s no perfect metric to capture style and layout – or indeed, rendering – even though all three can impact the user experience just as much as JavaScript.
However, it’s important to understand how the HTML5 event loop works, and to place performance marks at the appropriate points in the component rendering lifecycle. This can help avoid any mistaken conclusions about what’s “slower” or “faster” based on an incomplete view of the pipeline, and ensure that style and layout costs are accounted for.
I hope this blog post was useful, and that the art of measuring client-side performance is a little less mysterious now. And maybe it’s time to push browser vendors to add requestAnimationFrameAfterStyleAndLayout (we’ll bikeshed on the name though!).
Thanks to Ben Kelly, Todd Reifsteck, and Alex Russell for feedback on a draft of this blog post.

Posted by Philip Tellis (@bluesmoon) on September 26, 2018 at 7:50 AM
Nice work. Would love to get this added into boomerang’s continuity metrics, specifically to enhance our measure of time to visually ready.
Posted by Sergey Chernyshev on September 26, 2018 at 9:05 AM
Same here – I’ll be working it into UX Capture library: https://github.com/sergeychernyshev/ux-capture/issues/17
Posted by Steve Souders on September 26, 2018 at 6:05 PM
Wow Nolan! What a great post! Thank you so much. You made my day! (OK – enough exclamation points!!)
I wish Long Tasks API had information beyond just script. That would be the best way to track this – using instrumentation that is spec’ed and supported by the browser. I love that you’re helping motivate that by giving developers an alternative technique.
One downside of deploying this technique in RUM is that (AFAIK) this technique can’t separate JS execution from layout & render, but that might be important for developers to diagnose the problem. Is that true?
Posted by Nolan Lawson on September 27, 2018 at 9:14 AM
Thanks for the feedback! Yes, that is a downside of the Long Tasks API (AIUI), and could lead to the “fooling ourselves” example I gave with
getBoundingClientRect()(where we only measure JS execution and ignore the style/layout after).If you want to separate JS from style/layout costs, then I suppose the best bet is to put a mark in rAF for spec-compliant browsers, but then for non-spec-compliant browsers… I’m not sure. Perhaps microtasks? UA-sniffing might also be necessary for maximum accuracy. This goes back to the need for two separate rAF APIs…
Posted by Aziz Khambati (@azizhk110) on September 26, 2018 at 11:51 PM
Hi,
Wanted to know your thoughts on setImmediate in this case. How would it compare with rAF + rAF?
Posted by Nolan Lawson on September 27, 2018 at 9:21 AM
setImmediateis only supported in IE and Edge, and the main benefit is that it’s not clamped to 4ms, however it does also allow input events to “jump the queue” in IE whereassetTimeoutdoes not. (Although to be fair, all other browsers should allow input to jump the queue in front ofsetTimeout, so I suppose IE’ssetImmediateis more similar to other browsers’setTimeoutin that way.)All other things being equal, though, since
setImmediatedoesn’t clamp whereassetTimeoutdoes, then yes, usingsetImmediate || setTimeoutinside of rAF does seem reasonable to me. I’d have to test in Edge 18 though, to confirm that it does indeed fire after style/layout. Good suggestion!Posted by julienwajsberg on September 27, 2018 at 12:11 AM
Hey, thanks for the great post !
I wonder if a single setTimeout wouldn’t work here ?
(although I think that in a synthetic test I’d force a layout like you describe in the end)
Posted by Nolan Lawson on September 27, 2018 at 9:26 AM
A single
setTimeoutwouldn’t consistently work, because since it’s clamped to 4ms but a frame is typically 16.7ms (or longer, depending on the monitor), it could fire before rAF would. Hence rAF+setTimeout.Posted by Akira on September 27, 2018 at 4:51 AM
“calling getBoundingClientRect() is slower than not calling it!” did you mean faster?
Posted by Nolan Lawson on September 27, 2018 at 9:34 AM
Nope, I meant “slower.” :) The idea is if you only measure explicit JS execution, you’ll measure gBCR but none of the later style/layout costs. So moving costs from the right to the left “looks” slower, even though it’s the same.
Posted by fabiordp on September 28, 2018 at 5:19 PM
Thanks for sharing this Nolan. I made sure people on the DevTools team read it. We miss having your expertise in the house but glad you’re still sharing your knowledge publicly!
Posted by Vignesh on September 30, 2018 at 5:57 AM
Thanks for writing this great post.
We measure the JS execution cost of our front end scripts and have created a proxy metric for measuring interactivity. Have run in to the similar problem using rAF. One problem that is not mentioned here is
When there are multiple scripts on the page and the first few scripts that are executed does not cause any Reflow and Paint and the next scripts are trying to render something on the page, We will end up measuring the wrong JS execution cost for former scripts since rAF fires later on with the render.
We ended up not measuring the execution using rAF since it was inaccurate.
Posted by Dmitry on October 8, 2018 at 5:11 PM
The rAF + setTimeout approach is interesting but wouldn’t the end marker be potentially delayed if there were other macro tasks queued?
Posted by Philip Walton on October 15, 2018 at 11:00 PM
Great post, Nolan! Did you experiment with something like rAF + postMessage/setImmediate (or some other variant that queues a macrotask)? I’d be curious to know if that solves some of the limitations of setTimeout.
Posted by Nolan Lawson on November 19, 2018 at 12:22 PM
In one of the comments above, setImmediate was mentioned as well, and in principle yes I think it could save on the 4ms delay at least. As for postMessage, I didn’t test it out, but it may as well be slightly more accurate. :) Lots of room to tinker on this thing; maybe it should just be an open-source library! :D
Posted by Andre Wiggins (@andre_wiggins) on January 6, 2019 at 11:14 PM
Ask and you shall receive: https://github.com/andrewiggins/afterframe Will be on NPM soon at https://npm.im/afterframe
Posted by Nolan Lawson on January 6, 2019 at 11:22 PM
Nicely done! :) I think you may have improved on my methods as well, since AFAIK postMessage is not subject to the 4ms throttling. (May be worth verifying cross-browser, though.) Very cool!
Posted by alex on October 20, 2018 at 3:38 PM
What did you mean by JS executing but not necessarily compiling? Doesn’t it have to compile successfully first before it executes the code?
Posted by Nolan Lawson on November 19, 2018 at 12:21 PM
I just mean that the compilation costs may not necessary be covered in that particular section of the timeline. The compilation could have occurred earlier, or on a previous pageload (and then been cached), etc.
Posted by Sagiv on January 5, 2019 at 12:26 AM
This is a great post, thank you.
Though i feel like its not complete, i mean i would love to see an example on how to catch the specific code that causing slow layout and rendering.
Maybe a part 2 for this one? 🤓
Posted by Mohamed Hussain (@shmdhussain12) on January 6, 2019 at 12:11 AM
thanks Nolan for this interesting trick to measure the style/layout. I have two doubts after reading this,
when we call getBoundingClientRect() in the javascript, we are forcefully triggering the style/layout, which is making the JS execution time more, then why the style/layout step is missed in the next frame(i.e before the raff)? Is style/recalc be done all the time before raff execution?, or only be done when the DOM requires it bcz of JS execution which made the DOM dirty, before that frame?
When we call the getBoundingClientRect() repeatedly in JS and making the DOM changes, will only style/layout repeatedly be done or the paint will also be done with style/layout?
Posted by Introducing emoji-picker-element: a memory-efficient emoji picker for the web | Read the Tea Leaves on June 28, 2020 at 8:59 AM
[…] the load time, I measure from the beginning of the custom element’s constructor to the requestPostAnimationFrame (polyfilled) after rendering the first set of emoji and favorites […]
Posted by slb on January 10, 2023 at 11:12 PM
great!
test in chrome 101, rAf is after style+layout, before painting
Posted by Nolan Lawson on January 11, 2023 at 7:40 AM
Are you sure about this? If Chrome is doing rAF after style/layout, then that may be a bug. Per the HTML spec, “run the animation frame callbacks” (step 13) happens before “recalculate styles and update layout” (step 14).
Posted by slb on January 11, 2023 at 7:17 PM
https://codesandbox.io/s/test-raf-ml0q1l?file=/src/index.js
this is my test demo in chrome108 , chrome dev tool permance shows rAf is after style+layout and before paint。
maybe chrome change something in new version
I don’t know if my demo is correct
Posted by Nolan Lawson on January 14, 2023 at 8:52 AM
I tried your demo. I think the issue may be that you are doing multiple rAFs and multiple style/layout iterations, so it may be confusing which one corresponds to which.
If you try the simple demo component linked in my post, and click “Render component” while recording, and then search for “requestAnimationFrame” in the DevTools trace, you should be able to see that it fires before style/layout. I just tested in Chrome 108 on Linux and this is what I observe.
Posted by slb on January 15, 2023 at 7:39 PM
thank you for your reply!
now I tried your “Render Component” , but i can’t search requestAnimationFrame,
then i tried click “Render Component with setTimeout” and found that the result is different from you blog img(raf is before style+layout),
this is my devTool shows https://img.alicdn.com/imgextra/i4/O1CN01YTotqu1sPfkVPLsqu_!!6000000005759-2-tps-1178-406.png
hope for your reply, thanks
Posted by Nolan Lawson on January 18, 2023 at 7:14 AM
I can reproduce your result! I think what might be going on here is that Chrome has aligned the
clickevent withrAF, so callingrAFwithin the same tick results in the callback falling after style/layout. (Maybe this wasn’t the case when I originally wrote my blog post.)To confirm this theory, I modified the benchmark to wrap all the rendering in a
setTimeout(a non-rAF-aligned timer), and indeedrAFnow comes before style/layout (screenshot).Goes to show how hard it is to measure this stuff!
Posted by slb on January 18, 2023 at 6:41 PM
awesome!
i create rAf in a another Task, not in click event, raf is before style/layout !
i got this.
thank you very much
Posted by skychx on August 15, 2023 at 1:57 AM
https://www.webperf.tips/tip/measuring-paint-time/
https://www.webperf.tips/tip/react-hook-paint/
These two blog posts suggest that
MessageChannelcan be used to measure more accurate time. What do you think?Posted by Nolan Lawson on August 15, 2023 at 7:47 AM
Some browsers throttle
setTimeoutby 4ms, so yeah it may be more accurate to usepostMessage.