I was fascinated recently by “Why we’re breaking up with CSS-in-JS” by Sam Magura. It’s a great overview of some of the benefits and downsides of the “CSS-in-JS” pattern, as implemented by various libraries in the React ecosystem.
What really piqued my curiosity, though, was a link to this guide by Sebastian Markbåge on potential performance problems with CSS-in-JS when using concurrent rendering, a new feature in React 18.
Here is the relevant passage:
In concurrent rendering, React can yield to the browser between renders. If you insert a new rule in a component, then React yields, the browser then have to see if those rules would apply to the existing tree. So it recalculates the style rules. Then React renders the next component, and then that component discovers a new rule and it happens again.
This effectively causes a recalculation of all CSS rules against all DOM nodes every frame while React is rendering. This is VERY slow.
This concept was new and confusing to me, so I did what I often do in these cases: I wrote a benchmark.
Let’s benchmark it!
This benchmark is similar to my previous shadow DOM vs style scoping benchmark, with one twist: instead of rendering all “components” in one go, we render each one in its own requestAnimationFrame. This is to simulate a worst-case scenario for React concurrent rendering – where React yields between each component render, allowing the browser to recalculate style and layout.
In this benchmark, I’m rendering 200 “components,” with three kinds of stylesheets: unscoped (i.e. the most unperformant CSS I can think of), scoped-ala-Svelte (i.e. adding classes to every selector), and shadow DOM.
The “unscoped” CSS tells the clearest story:

In this Chrome trace, you can see that the style calculation costs steadily increase as each component is rendered. This seems to be exactly what Markbåge is talking about:
When you add or remove any CSS rules, you more or less have to reapply all rules that already existed to all nodes that already existed. Not just the changed ones. There are optimizations in browsers but at the end of the day, they don’t really avoid this problem.
In other words: not only are we paying style costs as every component renders, but those costs actually increase over time.
If we batch all of our style insertions before the components render, though, then we pay much lower style costs on each subsequent render:

To me, this is similar to layout thrashing. The main difference is that, with “classic” layout thrashing, you’re forcing a style/layout recalculation by calling some explicit API like getBoundingClientRect or offsetLeft. Whereas in this case, you’re not explicitly invoking a recalc, but instead implicitly forcing a recalc by yielding to the browser’s normal style/layout rendering loop.
I’ll also note that the second scenario could still be considered “layout thrashing” – the browser is still doing style/layout work on each frame. It’s just doing much less, because we’ve only invalidated the DOM elements and not the CSS rules.
Update: This benchmark does not perfectly simulate how React renders DOM nodes – see below for a slightly tweaked benchmark. The conclusion is still largely the same.
Here are the benchmark results for multiple browsers (200 components, median of 25 samples, 2014 Mac Mini):

Click for table
| Scenario |
Chrome 106 |
Firefox 106 |
Safari 16 |
| Unscoped |
20807.3 |
13589 |
14958 |
| Unscoped – styles in advance |
3392.5 |
3357 |
3406 |
| Scoped |
3330 |
3321 |
3330 |
| Scoped – styles in advance |
3358.9 |
3333 |
3339 |
| Shadow DOM |
3366.4 |
3326 |
3327 |
As you can see, injecting the styles in advance is much faster than the pay-as-you-go system: 20.8s vs 3.4s in Chrome (and similar for other browsers).
It also turns out that using scoped CSS mitigates the problem – there is little difference between upfront and per-component style injection. And shadow DOM doesn’t have a concept of “upfront styles” (the styles are naturally scoped and attached to each component), so it benefits accordingly.
Is scoping a panacea?
Note though, that scoping only mitigates the problem. If we increase the number of components, we start to see the same performance degradation:

Here are the benchmark results for 500 components (skipping “unscoped” this time around – I didn’t want to wait!):

Click for table
| Scenario |
Chrome 106 |
Firefox 106 |
Safari 16 |
| Scoped |
12490.6 |
8972 |
11059 |
| Scoped – styles in advance |
8413.4 |
8824 |
8561 |
| Shadow DOM |
8441.6 |
8949 |
8695 |
So even with style scoping, we’re better off injecting the styles in advance. And shadow DOM also performs better than “pay-as-you-go” scoped styles, presumably because it’s a browser-native scoping mechanism (as opposed to relying on the browser’s optimizations for class selectors). The exception is Firefox, which (in a recurring theme), seems to have some impressive optimizations in this area.
Is this something browsers could optimize more? Possibly. I do know that Chromium already weighs some tradeoffs with optimizing for upfront rendering vs re-rendering when stylesheets change. And Firefox seems to perform admirably with whatever CSS we throw at it.
So if this “inject and yield” pattern were prevalent enough on the web, then browsers might be incentivized to target it. But given that React concurrent rendering is somewhat new-ish, and given that the advice from React maintainers is already to batch style insertions, this seems somewhat unlikely to me.
Considering concurrent rendering
Unmentioned in either of the above posts is that this problem largely goes away if you’re not using concurrent rendering. If you do all of your DOM writes in one go, then you can’t layout thrash unless you’re explicitly calling APIs like getBoundingClientRect – which would be something for component authors to avoid, not for the framework to manage.
(Of course, in a long-lived web app, you could still have steadily increasing style costs as new CSS is injected and new components are rendered. But it seems unlikely to be quite as severe as the “rAF-based thrashing” above.)
I assume this, among other reasons, is why many non-React framework authors are skeptical of concurrent rendering. For instance, here’s Evan You (maintainer of Vue):
The pitfall here is not realizing that time slicing can only slice “slow render” induced by the framework – it can’t speed up DOM insertions or CSS layout. Also, staying responsive != fast. The user could end up waiting longer overall due to heavy scheduling overhead.
(Note that “time slicing” was the original name for concurrent rendering.)
Or for another example, here’s Rich Harris (maintainer of Svelte):
It’s not clear to me that [time slicing] is better than just having a framework that doesn’t have these bottlenecks in the first place. The best way to deliver a good user experience is to be extremely fast.
I feel a bit torn on this topic. I’ve seen the benefits of a “time slicing” or “debouncing” approach even when building Svelte components – for instance, both emoji-picker-element and Pinafore use requestIdleCallack (as described in this post) to improve responsiveness when typing into the text inputs. I found this improved the “feel” when typing, especially on a slower device (e.g. using Chrome DevTool’s 6x CPU throttling), even though both were written in Svelte. Svelte’s JavaScript may be fast, but the fastest JavaScript is no JavaScript at all!
That said, I’m not sure if this is something that should be handled by the framework rather than the component author. Yielding to the browser’s rendering loop is very useful in certain perf-sensitive scenarios (like typing into a text input), but in other cases it can worsen the overall performance (as we see with rendering components and their styles).
Is it worth it for the framework to make everything concurrent-capable and try to get the best of both worlds? I’m not so sure. Although I have to admire React for being bold enough to try.
Afterword
After this post was published, Mark Erikson wrote a helpful comment pointing out that inserting DOM nodes is not really something React does during “renders” (at least, in the context of concurrent rendering). So the benchmark would be more accurate if it inserted <style> nodes (as a “misbehaving” CSS-in-JS library would), but not component nodes, before yielding to the browser.
So I modified the benchmark to have a separate mode that delays inserting component DOM nodes until all components have “rendered.” To make it a bit fairer, I also pre-inserted the same number of initial components (but without style) – otherwise, the injected CSS rules wouldn’t have many DOM nodes to match against, so it wouldn’t be terribly representative of a real-world website.
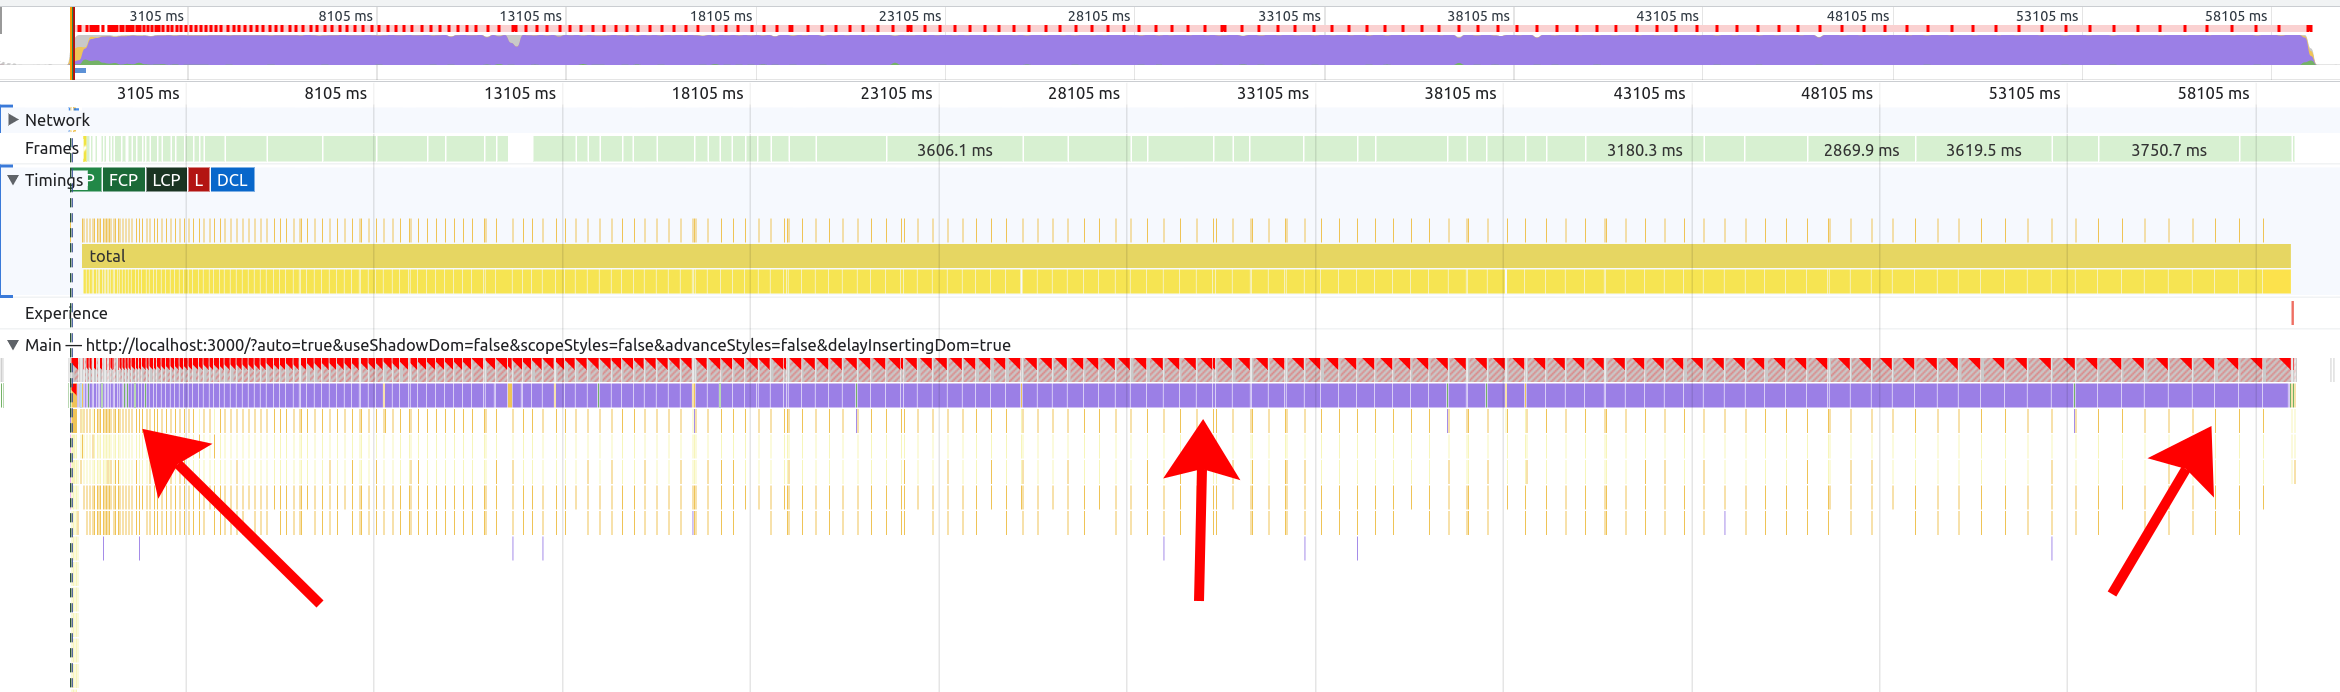
As it turns out, this doesn’t really change the conclusion – we still see gradually increasing style costs in a “layout thrashing” pattern, even when we’re only inserting <style>s between rAFs:

The main difference is that, when we front-load the style injections, the layout thrashing goes away entirely, because each rAF tick is neither reading from nor writing to the DOM. Instead, we have one big style cost at the start (when injecting the styles) and another at the end (when injecting the DOM nodes):

(In the above screenshot, the occasional purple slices in the middle are “Hit testing” and “Pre-paint,” not style or layout calculation.)
Note that this is still a teensy bit inaccurate, because now our rAF ticks aren’t doing anything, since this benchmark isn’t actually using React or virtual DOM. In a real-world example, there would be some JavaScript cost to running a React component’s render() function.
Still, we can run the modified benchmark against the various browsers, and see that the overall conclusion has not changed much (200 components, median of 25 samples, 2014 Mac Mini):

Click for table
| Scenario |
Chrome 106 |
Firefox 106 |
Safari 16 |
| Unscoped |
26180 |
17622 |
17349 |
| Unscoped – styles in advance |
3958.3 |
3663 |
3945 |
| Scoped |
3394.6 |
3370 |
3358 |
| Scoped – styles in advance |
3476.7 |
3374 |
3368 |
| Shadow DOM |
3378 |
3370 |
3408 |
So the lesson still seems to be: invalidating global CSS rules frequently is a performance anti-pattern. (Even moreso than inserting DOM nodes frequently!)
Afterword 2
I asked Emilio Cobos Álvarez about this, and he gave some great insights from the Firefox perspective:
We definitely have optimizations for that […] but the worst case is indeed “we restyle the whole document again”.
Some of the optimizations Firefox has are quite clever. For example, they optimize appending stylesheets (i.e. appending a new <style> to the <head>) more heavily than inserting (i.e. injecting a <style> between other <style>s) or deleting (i.e. removing a <style>).
Emilio explains why:
Since CSS is source-order dependent, insertions (and removals) cause us to rebuild all the relevant data structures to preserve ordering, while appends can be processed more easily.
Some of this work was apparently done as part of optimizations for Facebook.com back in 2017. I assume Facebook was appending a lot of <style>s, but not inserting or deleting (which makes sense – this is the dominant pattern I see in JavaScript frameworks today).
Firefox also has some specific optimizations for classes, IDs, and tag names (aka “local names”). But despite their best efforts, there are cases where everything needs to be marked as invalid.
So as a web developer, keeping a mental model of “when styles change, everything must be recalculated” is still accurate, at least for the worst case.