Archive for September, 2018

Accurately measuring layout on the web

Update (August 2019): the technique described below, in particular how to schedule an event to fire after style/layout calculations are complete, is now captured in a web API proposal called requestPostAnimationFrame. There is also a good polyfill called afterframe.

Update (October 2022): in 2019, WebKit updated their requestAnimationFrame implementation to align with Chrome and Firefox (i.e. rendering before the next frame).

We all want to make faster websites. The question is just what to measure, and how to use that information to determine what’s “slow” and what could be made faster.

The browser rendering pipeline is complicated. For that reason, it’s tricky to measure the performance of a webpage, especially when components are rendered client-side and everything becomes an intricate ballet between JavaScript, the DOM, styling, layout, and rendering. Many folks stick to what they understand, and so they may under-measure or completely mis-measure their website’s frontend performance.

So in this post, I want to demystify some of these concepts, and offer techniques for accurately measuring what’s going on when we render things on the web.

The web rendering pipeline

Let’s say we have a component that is rendered client-side, using JavaScript. To keep things simple, I wrote a demo component in vanilla JS, but everything I’m about to say would also apply to React, Vue, Angular, etc.

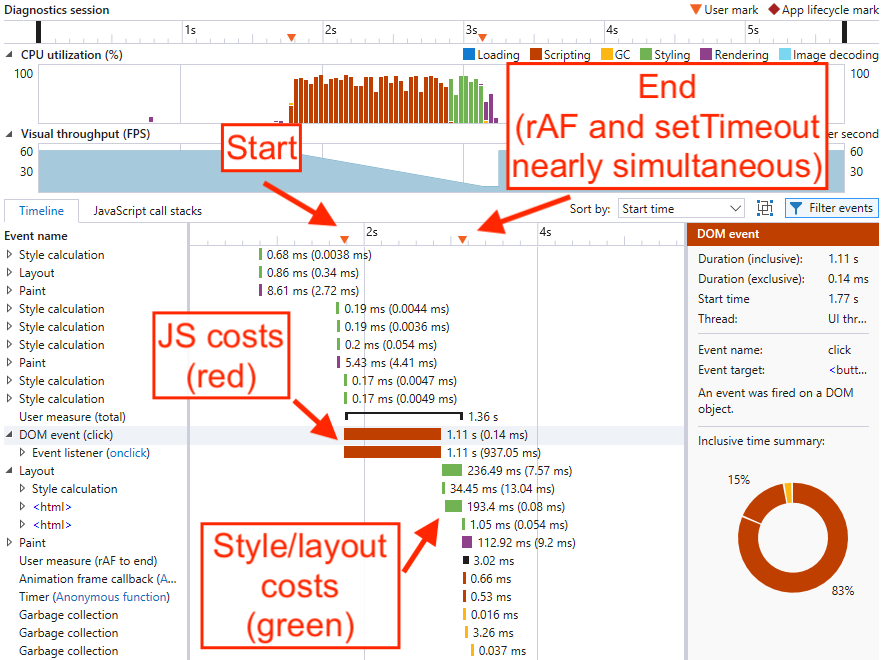
When we use the handy Performance profiler in the Chrome Dev Tools, we see something like this:

Screenshot of Chrome Dev Tools showing work on the UI thread divided into JavaScript, then Style, then Layout, then Render

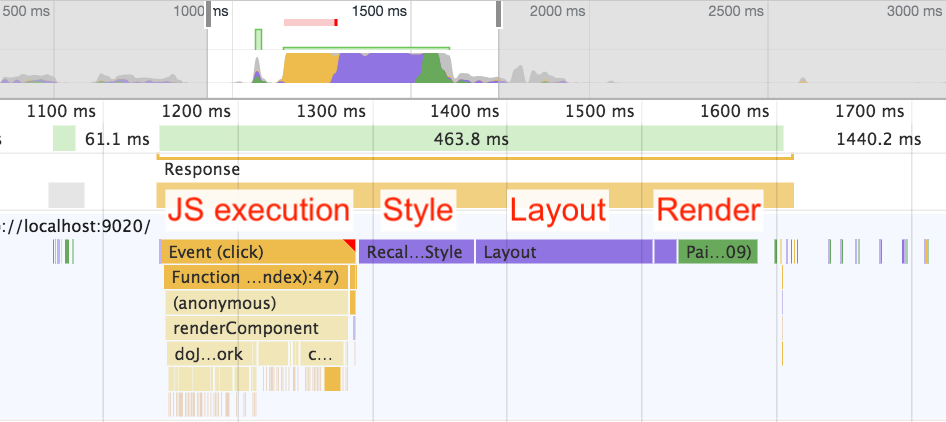
This is a view of the CPU costs of our component, in terms of milliseconds on the UI thread. To break things down, here are the steps required:

  1. Execute JavaScript – executing (but not necessarily compiling) JavaScript, including any state manipulation, “virtual DOM diffing,” and modifying the DOM.
  2. Calculate style – taking a CSS stylesheet and matching its selector rules with elements in the DOM. This is also known as “formatting.”
  3. Calculate layout – taking those CSS styles we calculated in step #2 and figuring out where the boxes should be laid out on the screen. This is also known as “reflow.”
  4. Render – the process of actually putting pixels on the screen. This often involves painting, compositing, GPU acceleration, and a separate rendering thread.

All of these steps invoke CPU costs, and therefore all of them can impact the user experience. If any one of them takes a long time, it can lead to the appearance of a slow-loading component.

The naïve approach

Now, the most common mistake that folks make when trying to measure this process is to skip steps 2, 3, and 4 entirely. In other words, they just measure the time spent executing JavaScript, and completely ignore everything after that.

Screenshot of Chrome Dev Tools, showing an arrow pointing after JavaScript but before Style and Layout with the text 'Most devs stop measuring here'

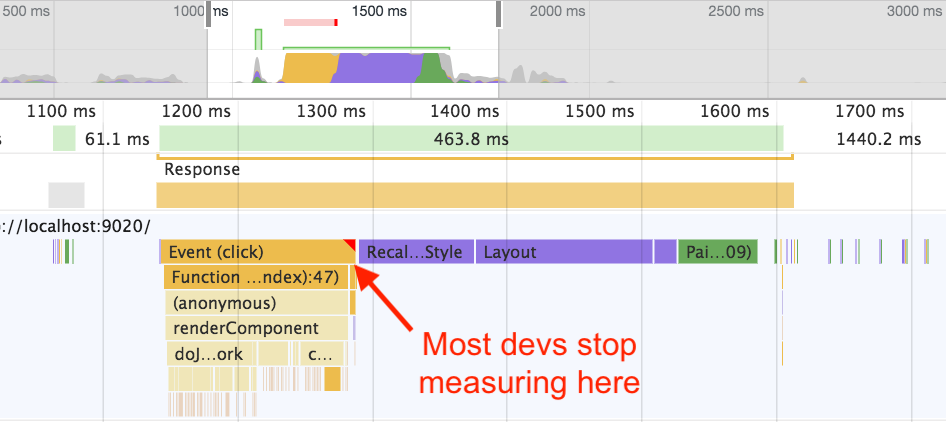
When I worked as a browser performance engineer, I would often look at a trace of a team’s website and ask them which mark they used to measure “done.” More often than not, it turned out that their mark landed right after JavaScript, but before style and layout, meaning the last bit of CPU work wasn’t being measured.

So how do we measure these costs? For the purposes of this post, let’s focus on how we measure style and layout in particular. As it turns out, the render step is much more complicated to measure, and indeed it’s impossible to measure accurately, because rendering is often a complex interplay between separate threads and the GPU, and therefore isn’t even visible to userland JavaScript running on the main thread.

Style and layout calculations, however, are 100% measurable because they block the main thread. And yes, this is true even with something like Firefox’s Stylo engine – even if multiple threads can be employed to speed up the work, ultimately the main thread has to wait on all the other threads to deliver the final result. This is just the way the web works, as specc’ed.

What to measure

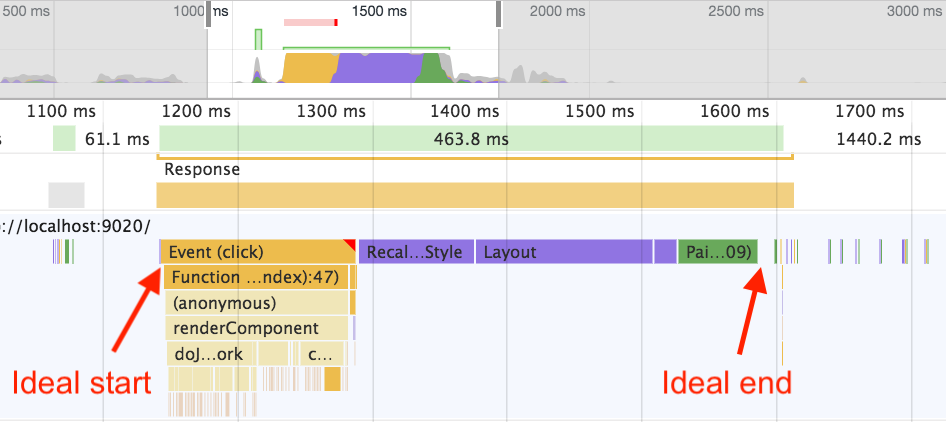
So in practical terms, we want to put a performance mark before our JavaScript starts executing, and another one after all the additional work is done:

Screenshot of Chrome Dev Tools, with arrow pointing before JavaScript execution saying 'Ideal start' and arrow pointing after Render (Paint) saying 'Ideal end'

I’ve written previously about various JavaScript timers on the web. Can any of these help us out?

As it turns out, requestAnimationFrame will be our main tool of choice, but there’s a problem. As Jake Archibald explains in his excellent talk on the event loop, browsers disagree on where to fire this callback:

Screenshot of Chrome Dev Tools showing arrow pointing before style/layout saying "Chrome, FF, Edge >= 18" and arrow pointing after style/layout saying "Safari, IE, Edge < 18"

Now, per the HTML5 event loop spec, requestAnimationFrame is indeed supposed to fire before style and layout are calculated. Edge has already fixed this in v18, and perhaps Safari will fix it in the future as well. But that would still leave us with inconsistent behavior in IE, as well as in older versions of Safari and Edge.

Also, if anything, the spec-compliant behavior actually makes it more difficult to measure style and layout! In an ideal world, the spec would have two timers – one for requestAnimationFrame, and another for requestAnimationFrameAfterStyleAndLayout (or something like that). In fact, there has been some discussion at the WHATWG about adding an API for this, but so far it’s just a gleam in the spec authors’ eyes.

Unfortunately, we live in the real world with real constraints, and we can’t wait for browsers to add this timer. So we’ll just have to figure out how to crack this nut, even with browsers disagreeing on when requestAnimationFrame should fire. Is there any solution that will work cross-browser?

Cross-browser “after frame” callback

There’s no solution that will work perfectly to place a callback right after style and layout, but based on the advice of Todd Reifsteck, I believe this comes closest:

requestAnimationFrame(() => {
  setTimeout(() => {
    performance.mark('end')
  })
})

Let’s break down what this code is doing. In the case of spec-compliant browsers, such as Chrome, it looks like this:

Screenshot of Chrome Dev Tools showing 'Start' before JavaScript execution, requestAnimationFrame before style/layout, and setTimeout falling a bit after Paint/Render

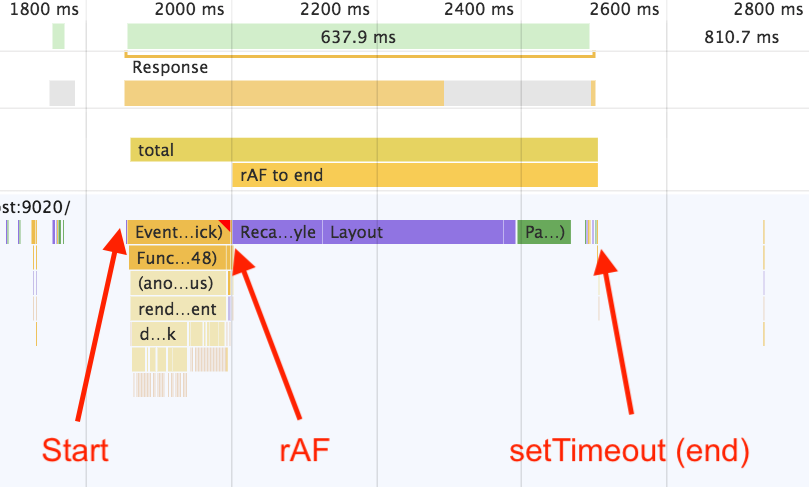
Note that rAF fires before style and layout, but the next setTimeout fires just after those steps (including “paint,” in this case).

And here’s how it works in non-spec-compliant browsers, such as Edge 17:

Screenshot of Edge F12 Tools showing 'Start' before JavaScript execution, and requestAnimationFrame/setTimeout both almost immediately after style/layout

Note that rAF fires after style and layout, and the next setTimeout happens so soon that the Edge F12 Tools actually render the two marks on top of each other.

So essentially, the trick is to queue a setTimeout callback inside of a rAF, which ensures that the second callback happens after style and layout, regardless of whether the browser is spec-compliant or not.

Downsides and alternatives

Now to be fair, there are a lot of problems with this technique:

  1. setTimeout is somewhat unpredictable in that it may be clamped to 4ms (or more in some cases).
  2. If there are any other setTimeout callbacks that have been queued elsewhere in the code, then ours may not be the last one to run.
  3. In the non-spec-compliant browsers, doing the setTimeout is actually a waste, because we already have a perfectly good place to set our mark – right inside the rAF!

However, if you’re looking for a one-size-fits-all solution for all browsers, rAF + setTimeout is about as close as you can get. Let’s consider some alternative approaches and why they wouldn’t work so well:
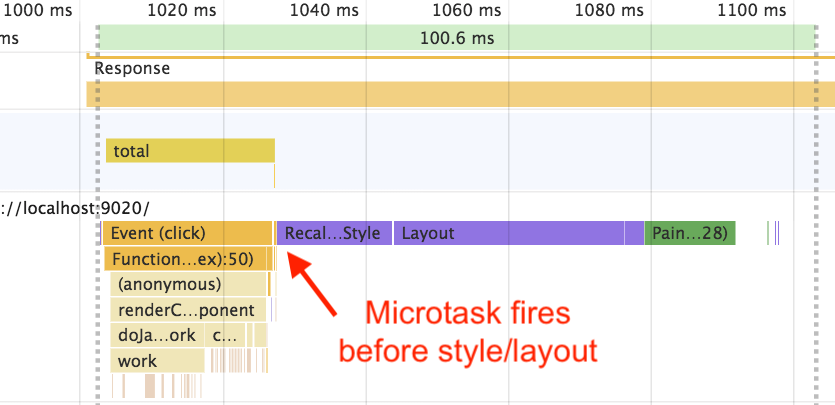
rAF + microtask

requestAnimationFrame(() => {
  Promise.resolve().then(() => {
    performance.mark('after')
  })
})

This one doesn’t work at all, because microtasks (e.g. Promises) run immediately after JavaScript execution has completed. So it doesn’t wait for style and layout at all:

Screenshot of Chrome Dev Tools showing microtask firing before style/layout

rAF + requestIdleCallback

requestAnimationFrame(() => {
  requestIdleCallback(() => {
    performance.mark('after')
  })
})

Calling requestIdleCallback from inside of a requestAnimationFrame will indeed capture style and layout:

Screenshot of Chrome Dev Tools showing requestIdleCallback firing a bit after render/paint

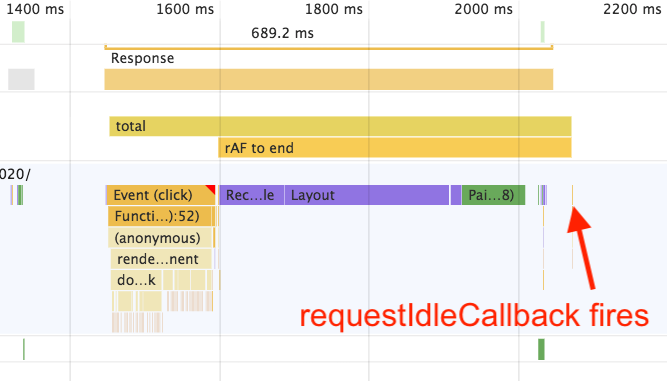
However, if the microtask version fires too early, I would worry that this one would fire too late. The screenshot above shows it firing fairly quickly, but if the main thread is busy doing other work, rIC could be delayed a long time waiting for the browser to decide that it’s safe to run some “idle” work. This one is far less of a sure bet than setTimeout.

rAF + rAF

requestAnimationFrame(() => {
  requestAnimationFrame(() => {
    performance.mark('after')
  })
})

This one, also called a “double rAF,” is a perfectly fine solution, but compared to the setTimeout version, it probably captures more idle time – roughly 16.7ms on a 60Hz screen, as opposed to the standard 4ms for setTimeout – and is therefore slightly more inaccurate.

Screenshot of Chrome Dev Tools showing a second requestAnimationFrame firing a bit after render/paint

You might wonder about that, given that I’ve already talked about setTimeout(0) not really firing in 0 (or even necessarily 4) milliseconds in a previous blog post. But keep in mind that, even though setTimeout() may be clamped by as much as a second, this only occurs in a background tab. And if we’re running in a background tab, we can’t count on rAF at all, because it may be paused altogether. (How to deal with noisy telemetry from background tabs is an interesting but separate question.)

So rAF+setTimeout, despite its flaws, is probably still better than rAF+rAF.

Not fooling ourselves

In any case, whether we choose rAF+setTimeout or double rAF, we can rest assured that we’re capturing any event-loop-driven style and layout costs. With this measure in place, it’s much less likely that we’ll fool ourselves by only measuring JavaScript and direct DOM API performance.

As an example, let’s consider what would happen if our style and layout costs weren’t just invoked by the event loop – that is, if our component were calling one of the many APIs that force style/layout recalculation, such as getBoundingClientRect(), offsetTop, etc.

If we call getBoundingClientRect() just once, notice that the style and layout calculations shift over into the middle of JavaScript execution:

Screenshot of Chrome Dev Tools showing style/layout costs moved to the left inside of JavaScript execution under getBoundingClientRect with red triangles on each purple rectangle

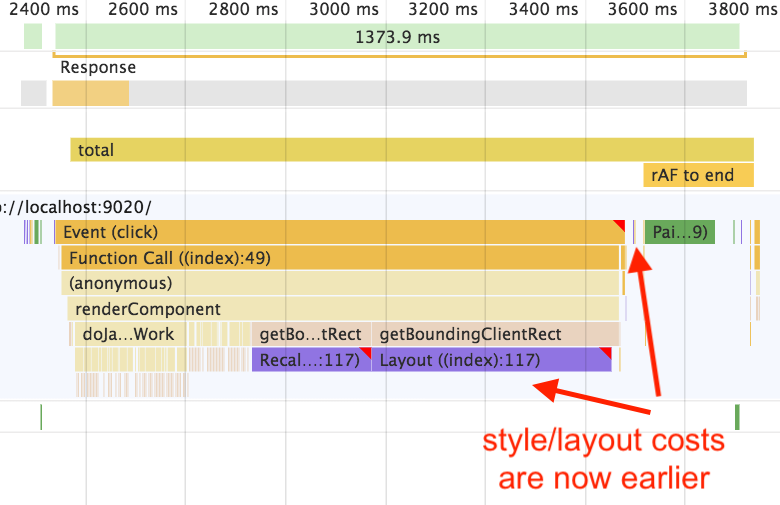
The important point here is that we’re not doing anything any slower or faster – we’ve merely moved the costs around. If we don’t measure the full costs of style and layout, though, we might deceive ourselves into thinking that calling getBoundingClientRect() is slower than not calling it! In fact, though, it’s just a case of robbing Peter to pay Paul.

It’s worth noting, though, that the Chrome Dev Tools have added little red triangles to our style/layout calculations, with the message “Forced reflow is a likely performance bottleneck.” This can be a bit misleading in this case, because again, the costs are not actually any higher – they’ve just moved to earlier in the trace.

(Now it’s true that, if we call getBoundingClientRect() repeatedly and change the DOM in the process, then we might invoke layout thrashing, in which case the overall costs would indeed be higher. So the Chrome Dev Tools are right to warn folks in that case.)

In any case, my point is that it’s easy to fool yourself if you only measure explicit JavaScript execution, and ignore any event-loop-driven style and layout costs that come afterward. The two costs may be scheduled differently, but they both impact performance.

Conclusion

Accurately measuring layout on the web is hard. There’s no perfect metric to capture style and layout – or indeed, rendering – even though all three can impact the user experience just as much as JavaScript.

However, it’s important to understand how the HTML5 event loop works, and to place performance marks at the appropriate points in the component rendering lifecycle. This can help avoid any mistaken conclusions about what’s “slower” or “faster” based on an incomplete view of the pipeline, and ensure that style and layout costs are accounted for.

I hope this blog post was useful, and that the art of measuring client-side performance is a little less mysterious now. And maybe it’s time to push browser vendors to add requestAnimationFrameAfterStyleAndLayout (we’ll bikeshed on the name though!).

Thanks to Ben Kelly, Todd Reifsteck, and Alex Russell for feedback on a draft of this blog post.

YubiKeys are neat

I recently picked up a YubiKey, because we use them at work and I was impressed with how simple and easy-to-use they are. I’ve been really happy with it so far – enough to write a blog post about it.

Photo of my YubiKeys on a keychain on a table

Basically, YubiKey works like this: whenever you need to do two-factor authentication (2FA), you just plug this little wafer into a USB port and tap a button, and it types out your one-time pass code. Interestingly, it does this by pretending to be a keyboard, which means it doesn’t require any special drivers. (Although it’s funny how Mac pops up a window saying, “Set up your keyboard…”)

The YubiKey Neo, which is the one I got, also supports NFC, so you can use it on a phone or tablet as well. I’ve only tested it on Android, but apparently iOS has some support too.

YubiKey is especially nice for sites like Google, GitHub, and Dropbox, because it runs directly in the browser using the FIDO U2F standard. Currently this is only supported in Chrome, but in Firefox you can also set security.webauth.u2f to true in about:config and it works just fine. (I use Firefox as my main browser, so I can confirm that this works across a variety of websites.)

One thing that pleasantly surprised me about YubiKey is that you can even use it for websites that don’t support U2F devices. Just download the Yubico Authenticator app, plug in your YubiKey, and now your YubiKey is an OTP app, i.e. a replacement for Google Authenticator, Authy, FreeOTP, etc. (Note that Yubico Authenticator doesn’t seem to support iOS, but it runs on desktops and Android, and is even open source on F-Droid.)

What I like the most about Yubico Authenticator is that it works the same across multiple devices, as long as you’re using the same YubiKey. This is great for me, because I have a weird Android setup, and so I’m frequently factory-resetting my phone, meaning I’d normally have to go through the hassle of setting up all my 2FA accounts again. But with YubiKey, I just have to remember to hold onto this little device that’s smaller than a stick of gum and fits on a keyring.

One thing I did find a bit annoying, though, is that the NFC communication between my YubiKey and OnePlus 5T is pretty spotty. To get it to work, I have to remove my phone from its case and the YubiKey from my keyring and clumsily mash them together a few times until it finally registers. But it does work.

Overall though, YubiKey is really cool. Definitely a worthy addition to one’s keyring, and as a bonus it makes me feel like a 21st-century James Bond. (I mean, when I plug it in and it “just works,” not when I’m mashing it into my phone like a monkey.)

If you’d like to read more about YubiKey and security, you might enjoy this article by Maciej Ceglowski on “basic security precautions for non-profits and journalists in the United States.”

Update: In addition to U2F, there is also an emerging standard called WebAuthn which is supported in Chrome, Firefox, and Edge without flags and is supported by YubiKey. So far though, website support seems limited, with Dropbox being a major exception.

Moving on from Microsoft

When I first joined Microsoft, I wrote an idealistic blog post describing the web as a public good, one that I hoped to serve by working for a browser vendor. I still believe in that vision of the web: it’s the freest platform on earth, it’s not totally dominated by any one entity, and it provides both users and developers with a degree of control that isn’t really available in the walled-garden app models of iOS, Android, etc.

Plaque saying "this is for everyone", dedicated, to Tim Berners-Lee

“This is for everyone”, a tribute to the web and Tim Berners-Lee (source)

After joining Microsoft, I continued to be blown away by the dedication and passion of those working on the Edge browser, many of whom shared my feelings about the open web. There were folks who were ex-Mozilla, ex-Opera, ex-Google, ex-Samsung – basically ex-AnyBrowserVendor. There were also plenty of Microsoft veterans who took their expertise in Windows, the CLR, and other Microsoft technologies and applied it with gusto to the unique challenges of the web.

It was fascinating to see so many people from so many different backgrounds working on something as enormously complex as a browser, and collaborating with like-minded folks at other browser vendors in the open forums of the W3C, TC39, WHATWG, and other standards bodies. Getting a peek behind the curtain at how the web “sausage” is made was a unique experience, and one that I cherish.

I’m also proud of the work I accomplished during my tenure at Microsoft. I wrote a blog post on how browser scrolling works, which not only provided a comprehensive overview for web developers, but I suspect may have even spurred Mozilla to up their scrolling game. (Congrats to Firefox for becoming the first browser to support asynchronous keyboard scrolling!)

I also did some work on the Intersection Observer spec, which I became interested in after discovering some cross-browser incompatibilities prompted by a bug in Mastodon. This was exactly the kind of thing I wanted to do for the web:

  1. Find a browser bug while working on an open-source project.
  2. Rather than just work around the bug, actually fix the browsers!
  3. Discuss the problem with the spec owners at other browser vendors.
  4. Submit the fixes to the spec and the web platform tests.

I didn’t do as much spec work as I would have liked (in particular, as a member of the Web Performance Working Group), but I am happy with the small contributions I managed to make.

While at Microsoft, I was also given the opportunity to speak at several conferences, an experience I found exhilarating if not a bit exhausting. (Eight talks in one year was perhaps too ambitious of me!) Overall, though, being a public speaker was a part of the browser gig that I thoroughly enjoyed, and the friendships I made with other conference attendees will surely linger in my mind long after I’ve forgotten whatever it was I gave a talk about. (Thankfully, though, there are always the videos!)

Photo of me delivering the talk "Solving the web performance crisis", a talk I gave on web performance

“Solving the web performance crisis,” a talk I gave on JavaScript performance (video link)

I also wrote a blog post on input responsiveness, which later inspired a post on JavaScript timers. It’s amazing how much you can learn about how a browser works by (wait for it) working on a browser! During my first year at Microsoft, I found myself steeped in discussions about the HTML5 event loop, Promises, setTimeout, setImmediate, and all the other wonderful ways of scheduling things on the web, because at the time we were knee-deep in rewriting the EdgeHTML event loop to improve performance and reliability.

Some of this work was even paralleled by other browser vendors, as shown in this blog post by Ben Kelly about Firefox 52. I fondly recall Ben and me swapping some benchmarks at a TPAC meeting. (When you get into the nitty-gritty of this stuff, sometimes it feels like other browser vendors are the only ones who really understand what you’re going through!)

I also did some work internal to Microsoft that I believe had a positive impact. In short, I met with lots of web teams and coached them on performance – walking through traces of Edge, IE, and Chrome – and helped them improve performance of their site across all browsers. Most of this coaching involved Windows Performance Analyzer, which is a surprisingly powerful tool despite being somewhat under-documented. (Although this post by my colleague Todd Reifsteck goes a long way toward demystifying some of the trickier aspects.)

I discussed this work a bit in an interview I did for Between the Wires, but most of it is private to the teams I worked with, since performance can be a tricky subject to talk about publicly. In general, neither browser vendors nor website owners want to shout to the heavens about their performance problems, so to avoid embarrassing both parties, most of the work I did in this area will probably never be public.

Presentation slide saying "you've founda  perf issue," either "website looks bad compared to competitors," or "browser looks bad compared to competitors" with hand-darwn "websites" and browser logos

A slide from a talk I gave at the Edge Web Summit (video link, photo source)

Still, this work (we called it “Performance Clubs”) was one of my favorite parts of working at Microsoft. Being a “performance consultant,” analyzing traces, and reasoning about the interplay between browser architecture and website architecture was something I really enjoyed. It was part education (I gave a lot of impromptu speeches in front of whiteboards!) and part detective work (lots of puzzling over traces, muttering to myself “this thread isn’t supposed to do that!”). But as someone who is fond of both people and technology, I think I was well-suited for the task.

After Microsoft, I’ll continue doing this same sort of work, but in a new context. I’ll be joining Salesforce as a developer working on the Lightning Platform. I’m looking forward to the challenges of building an easy-to-use web framework that doesn’t sacrifice on performance – anticipating the needs of developers as well as the inherent limitations of CPUs, GPUs, memory, storage, and networks.

It will also be fun to apply my knowledge of cross-browser differences to the enterprise space, where developers often don’t have the luxury of saying “just use another browser.” It’s an unforgiving environment to develop in, but those are exactly the kinds of challenges I relish about the web!

For those who follow me mostly for my open-source work, nothing will change with my transition to Salesforce. I intend to continue working on Mastodon- and JavaScript-related projects in my spare time, including Pinafore. In fact, my experience with Pinafore and SvelteJS may pay dividends at my new gig; one of my new coworkers even mentioned SvelteJS as their north star for building a great JavaScript framework. (Seems I may have found my tribe!) Much of my Salesforce work will also be open-source, so I’m looking forward to spending more time back on GitHub as well. (Although perhaps not as intensely as I used to.)

Leaving Microsoft is a bit bittersweet for me. I’m excited by the new challenges, but I’m also going to miss all the talented and passionate people whose company I enjoyed on the Microsoft Edge team. That said, the web is nothing if not a big tent, and there’s plenty of room to work in, on, and around it. To everyone else who loves the web as I do: I’m sure our paths will cross again.

A tour of JavaScript timers on the web

Pop quiz: what is the difference between these JavaScript timers?

  • Promises
  • setTimeout
  • setInterval
  • setImmediate
  • requestAnimationFrame
  • requestIdleCallback

More specifically, if you queue up all of these timers at once, do you have any idea which order they’ll fire in?

If not, you’re probably not alone. I’ve been doing JavaScript and web programming for years, I’ve worked for a browser vendor for two of those years, and it’s only recently that I really came to understand all these timers and how they play together.

In this post, I’m going to give a high-level overview of how these timers work, and when you might want to use them. I’ll also cover the Lodash functions debounce() and throttle(), because I find them useful as well.

Promises and microtasks

Let’s get this one out of the way first, because it’s probably the simplest. A Promise callback is also called a “microtask,” and it runs at the same frequency as MutationObserver callbacks. Assuming queueMicrotask() ever makes it out of spec-land and into browser-land, it will also be the same thing.

I’ve already written a lot about promises. One quick misconception about promises that’s worth covering, though, is that they don’t give the browser a chance to breathe. Just because you’re queuing up an asynchronous callback, that doesn’t mean that the browser can render, or process input, or do any of the stuff we want browsers to do.

For example, let’s say we have a function that blocks the main thread for 1 second:

function block() {
  var start = Date.now()
  while (Date.now() - start < 1000) { /* wheee */ }
}

If we were to queue up a bunch of microtasks to call this function:

for (var i = 0; i < 100; i++) {
  Promise.resolve().then(block)
}

This would block the browser for about 100 seconds. It’s basically the same as if we had done:

for (var i = 0; i < 100; i++) {
  block()
}

Microtasks execute immediately after any synchronous execution is complete. There’s no chance to fit in any work between the two. So if you think you can break up a long-running task by separating it into microtasks, then it won’t do what you think it’s doing.

setTimeout and setInterval

These two are cousins: setTimeout queues a task to run in x number of milliseconds, whereas setInterval queues a recurring task to run every x milliseconds.

The thing is… browsers don’t really respect that milliseconds thing. You see, historically, web developers have abused setTimeout. A lot. To the point where browsers have had to add mitigations for setTimeout(/* ... */, 0) to avoid locking up the browser’s main thread, because a lot of websites tended to throw around setTimeout(0) like confetti.

This is the reason that a lot of the tricks in crashmybrowser.com don’t work anymore, such as queuing up a setTimeout that calls two more setTimeouts, which call two more setTimeouts, etc. I covered a few of these mitigations from the Edge side of things in “Improving input responsiveness in Microsoft Edge”.

Broadly speaking, a setTimeout(0) doesn’t really run in zero milliseconds. Usually, it runs in 4. Sometimes, it may run in 16 (this is what Edge does when it’s on battery power, for instance). Sometimes it may be clamped to 1 second (e.g., when running in a background tab). These are the sorts of tricks that browsers have had to invent to prevent runaway web pages from chewing up your CPU doing useless setTimeout work.

So that said, setTimeout does allow the browser to run some work before the callback fires (unlike microtasks). But if your goal is to allow input or rendering to run before the callback, setTimeout is usually not the best choice because it only incidentally allows those things to happen. Nowadays, there are better browser APIs that can hook more directly into the browser’s rendering system.

setImmediate

Before moving on to those “better browser APIs,” it’s worth mentioning this thing. setImmediate is, for lack of a better word … weird. If you look it up on caniuse.com, you’ll see that only Microsoft browsers support it. And yet it also exists in Node.js, and has lots of “polyfills” on npm. What the heck is this thing?

setImmediate was originally proposed by Microsoft to get around the problems with setTimeout described above. Basically, setTimeout had been abused, and so the thinking was that we can create a new thing to allow setImmediate(0) to actually be setImmediate(0) and not this funky “clamped to 4ms” thing. You can see some discussion about it from Jason Weber back in 2011.

Unfortunately, setImmediate was only ever adopted by IE and Edge. Part of the reason it’s still in use is that it has a sort of superpower in IE, where it allows input events like keyboard and mouseclicks to “jump the queue” and fire before the setImmediate callback is executed, whereas IE doesn’t have the same magic for setTimeout. (Edge eventually fixed this, as detailed in the previously-mentioned post.)

Also, the fact that setImmediate exists in Node means that a lot of “Node-polyfilled” code is using it in the browser without really knowing what it does. It doesn’t help that the differences between Node’s setImmediate and process.nextTick are very confusing, and even the official Node docs say the names should really be reversed. (For the purposes of this blog post though, I’m going to focus on the browser rather than Node because I’m not a Node expert.)

Bottom line: use setImmediate if you know what you’re doing and you’re trying to optimize input performance for IE. If not, then just don’t bother. (Or only use it in Node.)

requestAnimationFrame

Now we get to the most important setTimeout replacement, a timer that actually hooks into the browser’s rendering loop. By the way, if you don’t know how the browser event loops works, I strongly recommend this talk by Jake Archibald. Go watch it, I’ll wait.

Okay, now that you’re back, requestAnimationFrame basically works like this: it’s sort of like a setTimeout, except instead of waiting for some unpredictable amount of time (4 milliseconds, 16 milliseconds, 1 second, etc.), it executes before the browser’s next style/layout calculation step. Now, as Jake points out in his talk, there is a minor wrinkle in that it actually executes after this step in Safari, IE, and Edge <18, but let's ignore that for now since it's usually not an important detail.

The way I think of requestAnimationFrame is this: whenever I want to do some work that I know is going to modify the browser's style or layout – for instance, changing CSS properties or starting up an animation – I stick it in a requestAnimationFrame (abbreviated to rAF from here on out). This ensures a few things:

  1. I'm less likely to layout thrash, because all of the changes to the DOM are being queued up and coordinated.
  2. My code will naturally adapt to the performance characteristics of the browser. For instance, if it's a low-cost device that is struggling to render some DOM elements, rAF will naturally slow down from the usual 16.7ms intervals (on 60 Hertz screens) and thus it won't bog down the machine in the same way that running a lot of setTimeouts or setIntervals might.

This is why animation libraries that don't rely on CSS transitions or keyframes, such as GreenSock or React Motion, will typically make their changes in a rAF callback. If you're animating an element between opacity: 0 and opacity: 1, there's no sense in queuing up a billion callbacks to animate every possible intermediate state, including opacity: 0.0000001 and opacity: 0.9999999.

Instead, you're better off just using rAF to let the browser tell you how many frames you're able to paint during a given period of time, and calculate the "tween" for that particular frame. That way, slow devices naturally end up with a slower framerate, and faster devices end up with a faster framerate, which wouldn't necessarily be true if you used something like setTimeout, which operates independently of the browser's rendering speed.

requestIdleCallback

rAF is probably the most useful timer in the toolkit, but requestIdleCallback is worth talking about as well. The browser support isn't great, but there's a polyfill that works just fine (and it uses rAF under the hood).

In many ways rAF is similar to requestIdleCallback. (I'll abbreviate it to rIC from now on. Starting to sound like a pair of troublemakers from West Side Story, huh? "There go Rick and Raff, up to no good!")

Like rAF, rIC will naturally adapt to the browser's performance characteristics: if the device is under heavy load, rIC may be delayed. The difference is that rIC fires on the browser "idle" state, i.e. when the browser has decided it doesn't have any tasks, microtasks, or input events to process, and you're free to do some work. It also gives you a "deadline" to track how much of your budget you're using, which is a nice feature.

Dan Abramov has a good talk from JSConf Iceland 2018 where he shows how you might use rIC. In the talk, he has a webapp that calls rIC for every keyboard event while the user is typing, and then it updates the rendered state inside of the callback. This is great because a fast typist can cause many keydown/keyup events to fire very quickly, but you don't necessarily want to update the rendered state of the page for every keypress.

Another good example of this is a “remaining character count” indicator on Twitter or Mastodon. I use rIC for this in Pinafore, because I don't really care if the indicator updates for every single key that I type. If I'm typing quickly, it's better to prioritize input responsiveness so that I don't lose my sense of flow.

Screenshot of Pinafore with some text entered in the text box and a digit counter showing the number of remaining characters

In Pinafore, the little horizontal bar and the “characters remaining” indicator update as you type.

One thing I’ve noticed about rIC, though, is that it’s a little finicky in Chrome. In Firefox it seems to fire whenever I would, intuitively, think that the browser is “idle” and ready to run some code. (Same goes for the polyfill.) In mobile Chrome for Android, though, I’ve noticed that whenever I scroll with touch scrolling, it might delay rIC for several seconds even after I’m done touching the screen and the browser is doing absolutely nothing. (I suspect the issue I’m seeing is this one.)

Update: Alex Russell from the Chrome team informs me that this is a known issue and should be fixed soon!

In any case, rIC is another great tool to add to the tool chest. I tend to think of it this way: use rAF for critical rendering work, use rIC for non-critical work.

debounce and throttle

These two functions aren’t built in to the browser, but they’re so useful that they’re worth calling out on their own. If you aren’t familiar with them, there’s a good breakdown in CSS Tricks.

My standard use for debounce is inside of a resize callback. When the user is resizing their browser window, there’s no point in updating the layout for every resize callback, because it fires too frequently. Instead, you can debounce for a few hundred milliseconds, which will ensure that the callback eventually fires once the user is done fiddling with their window size.

throttle, on the other hand, is something I use much more liberally. For instance, a good use case is inside of a scroll event. Once again, it’s usually senseless to try to update the rendered state of the app for every scroll callback, because it fires too frequently (and the frequency can vary from browser to browser and from input method to input method… ugh). Using throttle normalizes this behavior, and ensures that it only fires every x number of milliseconds. You can also tweak Lodash’s throttle (or debounce) function to fire at the start of the delay, at the end, both, or neither.

In contrast, I wouldn’t use debounce for the scrolling scenario, because I don’t want the UI to only update after the user has explicitly stopped scrolling. That can get annoying, or even confusing, because the user might get frustrated and try to keep scrolling in order to update the UI state (e.g. in an infinite-scrolling list). throttle is better in this case, because it doesn’t wait for the scroll event to stop firing.

throttle is a function I use all over the place for all kinds of user input, and even for some regularly-scheduled tasks like IndexedDB cleanups. It’s extremely useful. Maybe it should just be baked into the browser some day!

Conclusion

So that’s my whirlwind tour of the various timer functions available in the browser, and how you might use them. I probably missed a few, because there are certainly some exotic ones out there (postMessage or lifecycle events, anyone?). But hopefully this at least provides a good overview of how I think about JavaScript timers on the web.

How to deal with “discourse”

It was chaotic human weather. There’d be a nice morning and then suddenly a storm would roll in.

– Jaron Lanier, describing computer message boards in the 1970s (source, p. 42)

Are you tired of the “discourse” and drama in Mastodon and the fediverse? When it happens, do you wish it would just go away?

Here’s one simple trick to stop discourse dead in its tracks:

Don’t talk about it.

Now, this may sound too glib and oversimplified, so to put it in other words:

When discourse is happening, just don’t talk about it.

That’s it. That’s the way you solve discourse. It’s really as easy as that.

Discourse is a reflection of the innate human desire to not only look at a car crash, but to slow down and gawk at it, causing traffic to grind to a halt so that everyone else says, “Well, I may as well see what the fuss is about.” The more you talk about it, the more you feed it.

So just don’t. Don’t write hot takes on it, don’t make jokes about it, don’t comment on how you’re tired of it, don’t try to calm everybody down, don’t write a big thread about how discourse is ruining the fediverse and won’t it please stop. Just don’t. Pretend like it’s not even there.

There’s a scene in a Simpsons Halloween episode where a bunch of billboard ads have come to life and are running amuck, destroying Springfield. Eventually though, Lisa realizes that the only power ads have is the power we give them, and if you “just don’t look” then they’ll keel over and die.

Simpsons animation of billboard ads wrecking buildings with subtitle "Just don't look"

The “discourse” is exactly the same. Every time you talk about it, even just to mention it offhand or make a joke about it, it encourages more people to say to themselves, “Ooh, a fight! I gotta check this out.” Then they scroll back in their timeline to try to figure out the context, and the cycle begins anew. It’s like a disease that spreads by people complaining about it.

This is why whenever discourse is happening, I just talk about something else. I might also block or mute anyone who is talking about it, because I find the endless drama boring.

Like a car crash, it’s never really interesting. It’s never something that’s going to change your life by finding out about it. It’s always the same petty squabbling you’ve seen a hundred times online.

Once the storm has passed, though, it’s safe to talk about it. You may even write a longwinded blog post about it. But while it’s happening, remember: “just don’t look, just don’t look.”