Update: I’ve written a tool to automate many of the steps described in this post.
Part of the bargain we struck when we switched from building server-rendered websites to client-rendered SPAs is that we suddenly had to take a lot more care with the resources on the user’s device. Don’t block the UI thread, don’t make the laptop’s fan spin, don’t drain the phone’s battery, etc. We traded better interactivity and “app-like” behavior for a new class of problems that don’t really exist in the server-rendered world.
One of these problems is memory leaks. A poorly-coded SPA can easily eat up megabytes or even gigabytes of memory, continuing to gobble up more and more resources, even as it’s sitting innocently in a background tab. At this point, the page might start to slow to a crawl, or the browser may just terminate the tab and you’ll see Chrome’s familiar “Aw, snap!” page.
(Of course, a server-rendered website can also leak memory on the server side. But it’s extremely unlikely to leak memory on the client side, since the browser will clear the memory every time you navigate between pages.)
The subject of memory leaks is not well-covered in the web development literature. And yet, I’m pretty sure that most non-trivial SPAs leak memory, unless the team behind them has a robust infrastructure for catching and fixing memory leaks. It’s just far too easy in JavaScript to accidentally allocate some memory and forget to clean it up.
So why is so little written about memory leaks? My guesses:
- Lack of complaints: most users are not diligently watching Task Manager while they surf the web. Typically, you won’t hear about it from your users unless the leak is so bad that the tab is crashing or the app is slowing down.
- Lack of data: the Chrome team doesn’t provide data about how much memory websites are using in the wild. Nor are websites often measuring this themselves.
- Lack of tooling: it’s still not easy to identify or fix memory leaks with existing tooling.
- Lack of caring: browsers are pretty good at killing tabs that consume too much memory. Plus people seem to blame the browser rather than the websites.
In this post, I’d like to share some of my experience fixing memory leaks in web applications, and provide some examples of how to effectively track them down.
Anatomy of a memory leak
Modern web app frameworks like React, Vue, and Svelte use a component-based model. Within this model, the most common way to introduce a memory leak is something like this:
window.addEventListener('message', this.onMessage.bind(this));
That’s it. That’s all it takes to introduce a memory leak. If you call addEventListener on some global object (the window, the <body>, etc.) and then forget to clean it up with removeEventListener when the component is unmounted, then you’ve created a memory leak.
Worse, you’ve just leaked your entire component. Because this.onMessage is bound to this, the component has leaked. So have all of its child components. And very likely, so have all the DOM nodes associated with the components. This can get very bad very fast.
Here is the fix:
// Mount phase
this.onMessage = this.onMessage.bind(this);
window.addEventListener('message', this.onMessage);

// Unmount phase
window.removeEventListener('message', this.onMessage);
Note that we saved a reference to the bound onMessage function. You have to pass in exactly the same function to removeEventListener that you passed in to addEventListener, or else it won’t work.
The memory leak landscape
In my experience, the most common sources of memory leaks are APIs like these:
addEventListener. This is the most common one. CallremoveEventListenerto clean it up.setTimeout/setInterval. If you create a recurring timer (e.g. to run every 30 seconds), then you need to clean it up withclearTimeoutorclearInterval. (setTimeoutcan leak if it’s used likesetInterval– i.e., scheduling a newsetTimeoutinside of thesetTimeoutcallback.)IntersectionObserver,ResizeObserver,MutationObserver, etc. These new-ish APIs are very convenient, but they are also likely to leak. If you create one inside of a component, and it’s attached to a globally-available element, then you need to calldisconnect()to clean them up. (Note that DOM nodes which are garbage-collected will have their listeners and observers garbage-collected as well. So typically, you only need to worry about global elements, e.g. the<body>, thedocument, an omnipresent header/footer element, etc.)- Promises, Observables, EventEmitters, etc. Any programming model where you’re setting up a listener can leak memory if you forget to stop listening. (A Promise can leak if it’s never resolved or rejected, in which case any
.then()callbacks attached to it will leak.) - Global object stores. With something like Redux the state is global, so if you’re not careful, you can just keep appending memory to it and it will never get cleaned up.
- Infinite DOM growth. If you implement an infinite scrolling list without virtualization, then the number of DOM nodes will grow without bound.
Of course, there are plenty of other ways to leak memory, but these are the most common ones I’ve seen.
Identifying memory leaks
This is the hard part. I’ll start off by saying that I just don’t think any of the tooling out there is very good. I’ve tried Firefox’s memory tool, the Edge and IE memory tools, and even Windows Performance Analyzer. The best-in-class is still the Chrome Developer Tools, but it has a lot of rough edges that are worth knowing about.
In the Chrome DevTools, our main tool of choice is going to be the “heap snapshot” tool in the “Memory” tab. There are other memory tools in Chrome, but I don’t find them very helpful for identifying leaks.

The Heap Snapshot tool allows you to take a memory capture of the main thread or web workers or iframes.
When you click the “take snapshot” button, you’ve captured all the live objects in a particular JavaScript VM on that web page. This includes objects referenced by the window, objects referenced by setInterval callbacks, etc. Think of it as a frozen moment in time representing all the memory used by that web page.
The next step is to reproduce some scenario that you think may be leaking – for instance, opening and closing a modal dialog. Once the dialog is closed, you’d expect memory to return back to the previous level. So you take another snapshot, and then diff it with the previous snapshot. This diffing is really the killer feature of the tool.

However, there are a few limitations of the tool that you should be aware of:
- Even if you click the little “collect garbage” button, you may need to take a few consecutive snapshots for Chrome to truly clean up the unreferenced memory. In my experience, three should be enough. (Check the total memory size of each snapshot – it should eventually stabilize.)
- If you have web workers, service workers, iframes, shared workers, etc., then this memory will not be represented in the heap snapshot, because it lives in another JavaScript VM. You can capture this memory if you want, but just be sure you know which one you’re measuring.
- Sometimes the snapshotter will get stuck or crash. In that case, just close the browser tab and start all over again.
At this point, if your app is non-trivial, then you’re probably going to see a lot of leaking objects between the two snapshots. This is where things get tricky, because not all of these are true leaks. Many of these are just normal usage – some object gets de-allocated in favor of another one, something gets cached in a way that will get cleaned up later, etc.
Cutting through the noise
I’ve found that the best way to cut through the noise is to repeat the leaking scenario several times. For instance, instead of just opening and closing a modal dialog once, you might open and close it 7 times. (7 is a nice conspicuous prime number.) Then you can check the heap snapshot diff to see if any objects leaked 7 times. (Or 14 times, or 21 times.)
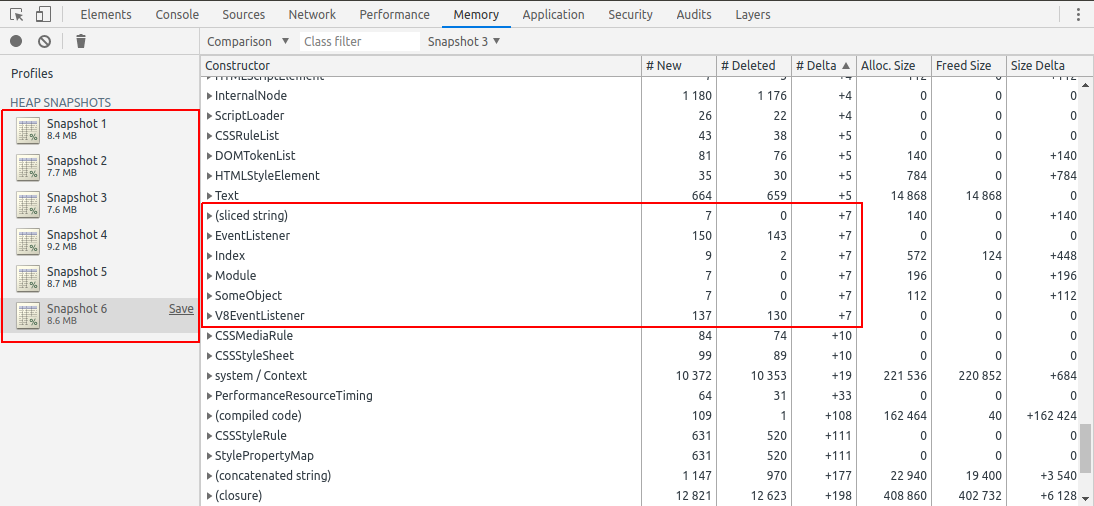
A heap snapshot diff. Note that we’re comparing snapshot #6 to snapshot #3, because I take three captures in a row to allow more garbage collection to occur. Also note that several objects are leaking 7 times.
(Another helpful technique is to run through the scenario once before recording the first snapshot. Especially if you are using a lot of code-splitting, then your scenario is likely to have a one-time memory cost of loading the necessary JavaScript modules.)
At this point, you might wonder why we should sort by the number of objects rather than the total memory. Intuitively, we’re trying to reduce the amount of memory leaking, so shouldn’t we focus on the total memory usage? Well, this doesn’t work very well, for an important reason.
When something is leaking, it’s because (to paraphrase Joe Armstrong) you’re holding onto the banana, but you ended up getting the banana, the gorilla holding the banana, and the whole jungle. If you measure based on total bytes, you’re measuring the jungle, not the banana.

Via Wikimedia Commons.
Let’s go back to the addEventListener example above. The source of the leak is an event listener, which is referencing a function, which references a component, which probably references a ton of stuff like arrays, strings, and objects.
If you sort the heap snapshot diff by total memory, then it’s going to show you a bunch of arrays, strings, and objects – most of which are probably unrelated to the leak. What you really want to find is the event listener, but this takes up a minuscule amount of memory compared to the stuff it’s referencing. To fix the leak, you want to find the banana, not the jungle.
So if you sort by the number of objects leaked, you’re going to see 7 event listeners. And maybe 7 components, and 14 sub-components, or something like that. That “7” should stand out like a sore thumb, since it’s such an unusual number. And no matter how many times you repeat the scenario, you should see exactly that number of objects leaking. This is how you can quickly find the source of the leak.
Walking the retainer tree
The heap snapshot diff will also show you a “retainer” chain showing which objects are pointing to which other objects and thus keeping the memory alive. This is how you can figure out where the leaking object was allocated.

The retainer chain shows you which object is referencing the leaked object. The way to read it is that each object is referenced by the object below it.
In the above example, there is a variable called someObject which is referenced by a closure (aka “context”), which is referenced by an event listener. If you click the source link, it will take you to the JavaScript declaration, which is fairly straightforward:
class SomeObject () { /* ... */ }

const someObject = new SomeObject();
const onMessage = () => { /* ... */ };
window.addEventListener('message', onMessage);
In the above example, the “context” is the onMessage closure which references the someObject variable. (This is a contrived example; real memory leaks can be much less obvious!)
But the heap snapshotting tool has several limitations:
- If you save and re-load the snapshot file, then you will lose all the file references to where the object was allocated. So for instance, you won’t see that the event listener’s closure comes from line 22 of
foo.js. Since this is really critical information, it’s almost useless to save and send heap snapshot files. - If there are
WeakMaps involved, then Chrome will show you those references even though they don’t really matter – those objects would be de-allocated as soon as the other references are cleaned up. So they are just noise. - Chrome classifies the objects by their prototype. So the more you use actual classes/functions and the less you use anonymous objects, the easier it will be to see what exactly is leaking. As an example, imagine if our leak was somehow due to an
objectrather than anEventListener. Sinceobjectis extremely generic, we’re unlikely to see exactly 7 of them leaking.
This is my basic strategy for identifying memory leaks. I’ve successfully used this technique to find dozens of memory leaks in the past.
This guide is just the start, though – beyond this, you will also have to be handy with setting breakpoints, logging, and testing your fix to see if it resolves the leak. Unfortunately, this is just inherently a time-consuming process.
Automated memory leak analysis
I’ll precede this by saying that I haven’t found a great way to automate the detection of memory leaks. Chrome has a non-standard performance.memory API, but for privacy reasons it doesn’t have a very precise granularity, so you can’t really use it in production to identify leaks. The W3C Web Performance Working Group has discussed memory tooling in the past, but has yet to agree on a new standard to replace this API.
In a lab or synthetic testing environment, you can increase the granularity on this API by using the Chrome flag --enable-precise-memory-info. You can also create heap snapshot files by calling the proprietary Chromedriver command :takeHeapSnapshot. This has the same limitation mentioned above, though – you probably want to take three in a row and discard the first two.
Since event listeners are the most common source of memory leaks, another technique that I’ve used is to monkey-patch the addEventListener and removeEventListener APIs to count the references and ensure they return to zero. Here is an example of how to do that.
In the Chrome DevTools, you can also use the proprietary getEventListeners() API to see the event listeners attached to a particular element. Note that this can only be used in DevTools, though.
Update: Mathias Bynens has informed me of another useful DevTools API: queryObjects(), which can show you all objects created with a particular constructor. Christoph Guttandin also has an interesting blog post about using this API for automated memory leak detection in Puppeteer.
Summary
The state of finding and fixing memory leaks in web apps is still fairly rudimentary. In this blog post, I’ve covered some of the techniques that have worked for me, but admittedly this is still a difficult and time-consuming process.
As with most performance problems, an ounce of prevention can be worth a pound of cure. You might find it worthwhile to put synthetic testing in place rather than trying to debug a memory leak after the fact. Especially if there are several leaks on a page, it will probably turn into an onion-peeling exercise – you fix one leak, then find another, then repeat (while weeping the whole time!). Code review can also help catch common memory leak patterns, if you know what to look for.
JavaScript is a memory-safe language, so it’s somewhat ironic how easy it is to leak memory in a web application. Part of this is just inherent to UI design, though – we need to listen for mouse events, scroll events, keyboard events, etc., and these are all patterns that can easily lead to memory leaks. But by trying to keep our web applications’ memory usage low, we can improve runtime performance, avoid crashes, and be respectful of resource constraints on the user’s device.
Thanks to Jake Archibald and Yang Guo for feedback on a draft of this post. And thanks to Dinko Bajric for inventing the “choose a prime number” technique, which I’ve found so helpful in memory leak analysis.


Posted by Samiullah Khan on February 19, 2020 at 11:46 PM
It looks like memory allocation is not given attention much but neither by browsers or SPA frameworks. But at least we can have some kind of diagnosis of our app performance. In setup like Vue+Vuetify+threejs, I won’t be able to pin down the exact culprit but I can have a general idea. Some time I feel Heap Snapshot as that console.time().
Thanks to this article, that I found out that threejs doesn’t destroy it’s scenes, objects etc on it’s own when we leave the component. Therefore the memory piles up to death. I hope the memory tooling improves on browser and framework side. On framework we do have size budgeting but not memory
Posted by Nolan Lawson on February 20, 2020 at 11:10 AM
I’m glad the post was helpful! Did you find if the leak was in your own app or in ThreeJS itself?
Posted by lcfvs on February 20, 2020 at 1:47 PM
Personally, with my anticore’s DOM companion, for the listeners, I’ve adopted another strategy.
My
forget = on(event, target, listener, options)returns a “forget” function which is used to remove the listener, as a simple call, preserving both the listener, target & options.https://github.com/Lcfvs/anticore-dom/blob/master/emitter/on.js
Posted by Nícholas André on February 21, 2020 at 6:03 PM
Very interesting stuff. Thanks for this post!
Posted by Amit on February 22, 2020 at 12:19 AM
Very useful article
Posted by Mahfoudh Arous on February 23, 2020 at 1:26 AM
Thank you for this interesting article 🙏! I wish I could share it on social media!
Posted by Nolan Lawson on February 24, 2020 at 10:01 AM
You can! :) Please feel free to share the link to the blog post wherever you’d like.
Posted by Andrey on February 24, 2020 at 5:49 AM
Answer, please, why snapshot, not timeline? For me timeline is faster and easier. But maybe i dont know smthng?
Posted by Nolan Lawson on February 24, 2020 at 10:01 AM
I find Timeline useful for CPU and rendering analysis, but not for memory. It has some memory tools, but like the Performance Monitor, I find it better for a high-level overview (e.g. total count of DOM nodes / listeners) than deep-dive analysis.
Chrome has lots of memory tools, but heap snapshot is just the one I’ve found to be the most helpful! :)
Posted by Andrey on February 25, 2020 at 10:45 AM
Oh, sorry, I didn’t specify – I wrote about the heaptimeline on the Memory tab.
For me, it is faster and easier. Do you usually record 6 snapshots and 7 repetitions of a test case? But with a heaptimeline, we usually do one record and 3-4 test case repetitions, it’s enough :)
Speaking of automation. We have written the tool for python unittests that will help to automate the memory leaks searching using UI tests. I will be glad If someone comes in handy or discuss it!
Saby/SeaLant on github
Posted by Joseph Scott Stevens on February 25, 2020 at 9:51 AM
Very useful article, I managed to find a few memory issues in our app, thanks! Oh, also, I don’t think you fully understand the Joe Armstrong quote, but it’s no biggie.
Posted by Nolan Lawson on February 25, 2020 at 3:05 PM
I realize the quote was about something else entirely, but I thought it was a nice evocative metaphor. :)
Posted by March 2020 dev links on March 2, 2020 at 9:54 AM
[…] Fixing memory leaks in web applications […]
Posted by John Vilk on March 4, 2020 at 9:22 PM
Hey Nolan!
I absolutely agree with you that memory leaks in web applications are a huge problem. I actually wrote an automated tool a couple of years ago to find these exact classes of leaks.
It’s called BLeak. The tool and an academic paper describing the underlying technique are available here:
http://plasma-umass.org/BLeak/
You can also view a presentation that summarizes the technique (it’s an academic talk, but aimed at a general technical audience):
The tl;dr is that BLeak runs your web application in a user-specified loop and looks for things in the heap that grow without bound. It then instruments the program to collect stack traces when those things grow. Finally, it uses the heap to “rank” the leaks by their impact (using a new metric I call LeakShare; retained size does not work well, since oftentimes multiple leaks leak the same objects).
BLeak found many leaks of type 1, 5, and 6 in the wild. I don’t think the implementation as-is would detect leaks of type 2, 3, or 4 — but it can easily be extended to lightly shim those APIs to track those global resources (e.g., by tracking active timers, promises, and observables). Then, it would be able to observe leaks as those resources grow in size.
I’m happy to answer questions if you have any. :)
Posted by Nolan Lawson on March 8, 2020 at 9:49 AM
Wow, this looks really impressive! I’ll have to check this out, thanks! :)
Posted by Prasad on May 14, 2020 at 10:31 AM
well written article on handling memory leaks, thanks for the share.
Posted by stefinho on July 30, 2020 at 4:42 AM
Very nice article.
I develop a SPA with Angular and memory leaks investigation is indeed a big issue not easy to address.
Chrome Dev Tools is not always easy to use, especially when there is framework/libraries wrapping your code all around.. Moreover, V8 garbage collector behavior is quite unpredictable, making it hard to see what is really as leak and what is not.
I will try your method of investigation with 7 heapsnapshots, it is pretty simple and seems to give good results.
To automate memory leak analysis I am using Selenium to repeat an action on a web browser, and I call window.gc() and window.memory.usedJSHeapSize from Selenium after each step to call garbage collector and see if memory usage increase over time.
Posted by matthewmarichiba on October 13, 2020 at 4:28 PM
Thanks for this. I’m banging my head on a leaky app and trying to rapid-learn how to memory profile & find DOM leaks with Chrome. Confirmation that a) this is hard, b) the devtools tooling isn’t super helpful saved my sanity today.
Posted by JavaScript performance beyond bundle size | Read the Tea Leaves on February 23, 2021 at 8:38 AM
[…] already wrote a post about memory leaks last year, but it’s important to remember that memory usage and memory leaks are two separate […]
Posted by Introducing fuite: a tool for finding memory leaks in web apps | Read the Tea Leaves on December 17, 2021 at 7:03 AM
[…] I’ve written about memory leaks in the past, but my advice basically boils down to: “Use the Chrome DevTools, follow these dozen tedious steps, and then maybe you can figure out why your page is leaking.” This is not a great developer experience, and I’m sure many readers just shook their heads in despair and moved on. It would be much better if a tool could find memory leaks automatically. […]
Posted by Memory leaks: the forgotten side of web performance | Read the Tea Leaves on January 5, 2022 at 7:25 AM
[…] those who have poked around in the browser DevTools to dabble in the arcane art of memory leak detection have probably found the experience… daunting. The effort-to-payoff ratio is disappointingly high, […]