I’ve researched and learned enough about client-side memory leaks to know that most web developers aren’t worrying about them too much. If a web app leaks 5 MB on every interaction, but it still works and nobody notices, then does it matter? (Kinda sounds like a “tree in the forest” koan, but bear with me.)
Even those who have poked around in the browser DevTools to dabble in the arcane art of memory leak detection have probably found the experience… daunting. The effort-to-payoff ratio is disappointingly high, especially compared to the hundreds of other things that are important in web development, like security and accessibility.
So is it really worth the effort? Do memory leaks actually matter?
I would argue that they do matter, if only because the lack of care (as shown by public-facing SPAs leaking up to 186 MB per interaction) is a sign of the immaturity of our field, and an opportunity for growth. Similarly, five years ago, there was much less concern among SPA authors for accessibility, security, runtime performance, or even ensuring that the back button maintained scroll position (or that the back button worked at all!). Today, I see a lot more discussion of these topics among SPA developers, and that’s a great sign that our field is starting to take our craft more seriously.
So why should you, and why shouldn’t you, care about memory leaks? Obviously I’m biased because I have an axe to grind (and a tool I wrote, fuite), but let me try to give an even-handed take.
Memory leaks and software engineering
In terms of actual impact on the business of web development, memory leaks are a funny thing. If you speed up your website by 2 seconds, everyone agrees that that’s a good thing with a visible user impact. If you reduce your website’s memory leak by 2 MB, can we still agree it was worth it? Maybe not.
Here are some of the unique characteristics of memory leaks that I’ve observed, in terms of how they actually fit into the web development process. Memory leaks are:
- Low-impact until critical
- Hard to diagnose
- Trivial to fix once diagnosed
Low-impact…
Most web apps can leak memory and no one will ever notice. Not the user, not the website author – nobody. There are a few reasons for this.
First off, browsers are well aware that the web is a leaky mess and are already ruthless about killing background tabs that consume too much memory. (My former colleague on the Microsoft Edge performance team, Todd Reifsteck, told me way back in 2016 that “the web leaks like a sieve.”) A lot of users are tab hoarders (essentially using tabs as bookmarks), and there’s a tacit understanding between browser and user that you can’t really have 100 tabs open at once (in the sense that the tab is actively running and instantly available). So you click on a tab that’s a few weeks old, boom, there’s a flash of white while the page loads, and nobody seems to mind much.
Second off, even for long-lived SPAs that the user may habitually check in on (think: GMail, Evernote, Discord), there are plenty of opportunities for a page refresh. The browser needs to update. The user doesn’t trust that the data is fresh and hits F5. Something goes wrong because programmers are terrible at managing state, and users are well aware that the old turn-it-off-and-back-on-again solves most problems. All of this means that even a multi-MB leak can go undetected, since a refresh will almost always occur before an Out Of Memory crash.
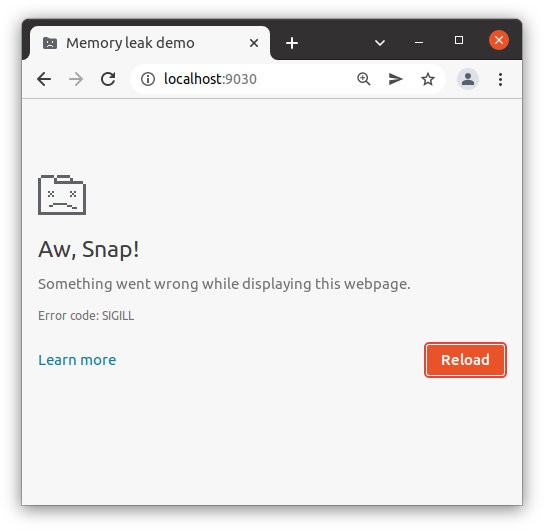
Chrome’s Out Of Memory error page. If you see this, something has gone very wrong.
Third, it’s a tragedy-of-the-commons situation, and people tend to blame the browser. Chrome is a memory hog. Firefox gobbles up RAM. Safari is eating all my memory. For reasons I can’t quite explain, people with 100+ open tabs are quick to blame the messenger. Maybe this goes back to the first point: tab hoarders expect the browser to automatically transition tabs from “thing I’m actively using” to “background thing that is basically a bookmark,” seamlessly and without a hitch. Browsers have different heuristics about this, some heuristics are better than others, and so in that sense, maybe it is the browser’s “fault” for failing to adapt to the user’s tab-hoarding behavior. In any case, the website author tends to escape the blame, especially if their site is just 1 out of 100 naughty tabs that are all leaking memory. (Although this may change as more browsers call out tabs individually in Task Manager, e.g. Edge and Safari.)
…Until critical
What’s interesting, though, is that every so often a memory leak will get so bad that people actually start to notice. Maybe someone opens up Task Manager and wonders why a note-taking app is consuming more RAM than DOTA. Maybe the website slows to a crawl after a few hours of usage. Maybe the users are on a device with low available memory (and of course the developers, with their 32GB workstations, never noticed).
Here’s what often happens in this case: a ticket lands on some web developer’s desk that says “Memory usage is too high, fix it.” The developer thinks to themselves, “I’ve never given much thought to memory usage, well let’s take a stab at this.” At some point they probably open up DevTools, click “Memory,” click “Take snapshot,” and… it’s a mess. Because it turns out that the SPA leaks, has always leaked, and in fact has multiple leaks that have accumulated over time. The developer assumes this is some kind of sudden-onset disease, when in fact it’s a pre-existing condition that has gradually escalated to stage-4.
The funny thing is that the source of the leak – the event listener, the subscriber, whatever – might not even be the proximate cause of the recent crisis. It might have been there all along, and was originally a tiny 1 MB leak nobody noticed, until suddenly someone attached a much bigger object to the existing leak, and now it’s a 100 MB leak that no one can ignore.
Unfortunately to get there, you’re going to have to hack your way through the jungle of the half-dozen other leaks that you ignored up to this point. (We fixed the leak! Oh wait, no we didn’t. We fixed the other leak! Oh wait, there’s still one more…) But that’s how it goes when you ignore a chronic but steadily worsening illness until the moment it becomes a crisis.
Hard to diagnose
This brings us to the second point: memory leaks are hard to diagnose. I’ve already written a lot about this, and I won’t rehash old content. Suffice it to say, the tooling is not really up to the task (despite some nice recent innovations), even if you’re a veteran with years of web development experience. Some gotchas that tripped me up include the fact that you have to ignore WeakMaps and circular references, and that the DevTools console itself can leak memory.
Oh and also, browsers themselves can have memory leaks! For instance, see these ResizeObserver/IntersectionObserver leaks in Chromium, Firefox, and Safari (fixed in all but Firefox), or this Chromium leak in lazy-loading images (not fixed), or this discussion of a leak in Safari. Of course, the tooling will not help you distinguish between browser leaks and web page leaks, so you just kinda have to know this stuff. In short: good luck!
Even with the tool that I’ve written, fuite, I won’t claim that we’ve reached a golden age of memory leak debugging. My tool is better than what’s out there, but that’s not saying much. It can catch the dumb stuff, such as leaking event listeners and DOM nodes, and for the more complex stuff like leaking collections (Arrays, Maps, etc.), it can at least point you in the right direction. But it’s still up to the web developer to decide which leaks are worth chasing (some are trivial, others are massive), and to track them down.
I still believe that the browser DevTools (or perhaps professional testing tools, such as Cypress or Sentry), should be the ones to handle this kind of thing. The browser especially is in a much better position to figure out why memory is leaking, and to point the web developer towards solutions. fuite is the best I could do with userland tooling (such as Puppeteer), but overall I’d still say we’re in the Stone Age, not the Space Age. (Maybe fuite pushed us to the Bronze Age, if I’m being generous to myself.)
Trivial to fix once diagnosed
Here’s the really surprising thing about memory leaks, though, and perhaps the reason I find them so addictive and keep coming back to them: once you figure out where the leak is coming from, they’re usually trivial to fix. For instance:
- You called
addEventListenerbut forgot to callremoveEventListener. - You called
setInterval, but forgot to callclearIntervalwhen the component unloaded. - You added a DOM node, but forgot to remove it when the page transitions away.
- Etc.
You might have a multi-MB leak, and the fix is one line of code. That’s a massive bang-for-the-buck! That is, if you discount the days of work it might have taken to find that line of code.
This is where I would like to go with fuite. It would be amazing if you could just point a tool at your website and have it tell you exactly which line of code caused a leak. (It’d be even better if it could open a pull request to fix the leak, but hey, let’s not get ahead of ourselves.)
I’ve taken some baby steps in this direction by adding stacktraces for leaking collections. So for instance, if you have an Array that is growing by 1 on every user interaction, fuite can tell you which line of code actually called Array.push(). This is a huge improvement over v1.0 of fuite (which just told you the Array was leaking, but not why), and although there are edge cases where it doesn’t work, I’m pretty proud of this feature. My goal is to expand this to other leaks (event listeners, DOM nodes, etc.), although since this is just a tool I’m building in my spare time, we’ll see if I get to it.

fuite showing stacktraces for leaking collections.
After releasing this tool, I also learned that Facebook has built a similar tool and is planning to open-source it soon. That’s great! I’m excited to see how it works, and I’m hoping that having more tools in this space will help us move past the Stone Age of memory leak debugging.
Conclusion
So to bring it back around: should you care about memory leaks? Well, if your boss is yelling at you because customers are complaining about Out Of Memory crashes, then yeah, you absolutely should. Are you leaking 5 MB, and nobody has complained yet? Well, maybe an ounce of prevention is worth a pound of cure in this case. If you start fixing your memory leaks now, it might avoid that crisis in the future when 5 MB suddenly grows to 50 MB.
Alternatively, are you leaking a measly ~1 kB because your routing library is appending some metadata to an Array? Well, maybe you can let that one slide. (fuite will still report this leak, but I would argue that it’s not worth fixing.)
On the other hand, all of these leaks are important in some sense, because even thinking about them shows a dedication to craftsmanship that is (in my opinion) too often lacking in web development. People write a web app, they throw something buggy over the wall, and then they rewrite their frontend four years later after users are complaining too much. I see this all the time when I observe how my wife uses her computer – she’s constantly telling me that some app gets slower or buggier the longer she uses it, until she gives up and refreshes. Whenever I help her with her computer troubles, I feel like I have to make excuses for my entire industry, for why we feel it’s acceptable to waste our users’ time with shoddy, half-baked software.
Maybe I’m just a dreamer and an idealist, but I really enjoy putting that final polish on something and feeling proud of what I’ve created. I notice, too, when the software I use has that extra touch of love and care – and it gives me more confidence in the product and the team behind it. When I press the back button and it doesn’t work, I lose a bit of trust. When I press Esc on a modal and it doesn’t close, I lose a bit of trust. And if an app keeps slowing down until I’m forced to refresh, or if I notice the memory steadily creeping up, I lose a bit of trust. I would like to think that fixing memory leaks is part of that extra polish that won’t necessarily win you a lot of accolades, but your users will subtly notice, and it will build their confidence in your software.
Thanks to Jake Archibald and Todd Reifsteck for feedback on a draft of this post.


Posted by Anon on January 9, 2022 at 5:55 PM
I’ve also been working with memory leaks and I was about to make a similar tool. Great to see someone else have the same idea and share the work :)
Posted by John Vilk on January 9, 2022 at 9:48 PM
Hey Nolan,
You might find my work on BLeak, a web app memory leak debugger, from 2018 interesting:
http://bleak-detector.org/
Unlike fuite, it requires a user-provided script for performing some action in a loop. But otherwise it identifies objects/heap paths that grow with every iteration, instruments the program and records stack traces when they grow, and quantifies their impact using an algorithm that “splits the credit” for leaked state across multiple growing objects.
The webpage links to an academic paper describing the approach which I tried to write in a way that is accessible to folks outside of the academic community. I found leaks in pretty much every webpage/app I threw at it.
Maybe you’ll find it interesting!
Posted by John Vilk on January 9, 2022 at 9:55 PM
I just realized I commented on one of your precious posts, haha. Anyway, glad to see more work in this space!
Posted by Nolan Lawson on January 10, 2022 at 5:11 PM
Hey John! I actually took a look at BLeak before writing my own tool, but unfortunately I couldn’t get it to run. I definitely took inspiration, though, from the fact that BLeak showed how common leaks are in the wild! Fuite is showing similar results – the vast majority of SPAs I’ve tested have leaks.
Posted by intrnl on January 10, 2022 at 4:12 PM
It doesn’t seem like you’d need to manually remove event listeners when you detach an element anymore in recent browsers, it’s properly garbage collected from what I can tell.
Posted by Nolan Lawson on January 10, 2022 at 5:13 PM
True, if the element is removed, then its event listeners are removed as well. This also applies to event listeners attached to things like IndexedDB databases.
However, elements like the window, document, body, and any omnipresent elements (header, footer, etc.) can leak if event listeners are attached to them.
Posted by Weekly Bullet #32 – Summary for the week – Performance Engineering Blog on January 16, 2022 at 6:03 PM
[…] Memory leaks on client side – the forgotten side of web performance. Link […]
Posted by Știri #55 - BreakingPoint on February 3, 2022 at 2:51 AM
[…] Memory leaks: the forgotten side of web performance | Read the Tea Leaves […]
Posted by O. Jones on February 4, 2022 at 10:45 AM
Why fix memory leaks? Among other reasons, milliseconds and nanowatt-hours really add up in widely deployed apps. GC attempts consume time and power especially when the heaps are vast.
Posted by Chait pinn on February 4, 2022 at 1:03 PM
Very interesting read, Microsoft Edge recently released a new tool in DevTools that checks for detached elements in the website.
https://docs.microsoft.com/en-us/microsoft-edge/devtools-guide-chromium/memory-problems/dom-leaks
Disclaimer: I work in Microsoft Edge DevTools team, interested to hear your thoughts about this.
Posted by Nolan Lawson on February 14, 2022 at 7:48 AM
I think it’s a great addition! I’d love to see more stuff like this in browser DevTools. 🙂
Posted by 郝二优 on February 9, 2022 at 9:39 PM
This is definitely a great article explaining why fixing memory leaks is so important!
Posted by More thoughts on SPAs | Read the Tea Leaves on May 25, 2022 at 8:16 AM
[…] Memory leaks? I’ve harped on this a lot in the past, and admittedly, this wouldn’t fully solve the problem. You’d probably just move the leaks into the Service Worker. But a Service Worker has a fire-and-forget model, so the browser could easily terminate it and restart it if it uses up too much memory, and the user might never notice. […]
Posted by State is hard: why SPAs will persist | Read the Tea Leaves on May 29, 2022 at 9:43 AM
[…] never gets blown away is exactly what leads to memory leaks – a problem endemic to SPAs that I’ve already documented ad nauseam. Plus, the further that the state can veer from a known good initial value, the more likely you are […]
Posted by Joe Doe on October 28, 2022 at 7:08 AM
Extremely well written article. Thank you.