Author Archive

Why I’m skeptical of rewriting JavaScript tools in “faster” languages

I’ve written a lot of JavaScript. I like JavaScript. And more importantly, I’ve built up a set of skills in understanding, optimizing, and debugging JavaScript that I’m reluctant to give up on.

So maybe it’s natural that I get a worried pit in my stomach over the current mania to rewrite every Node.js tool in a “faster” language like Rust, Zig, Go, etc. Don’t get me wrong – these languages are cool! (I’ve got a copy of the Rust book on my desk right now, and I even contributed a bit to Servo for fun.) But ultimately, I’ve invested a ton of my career in learning the ins and outs of JavaScript, and it’s by far the language I’m most comfortable with.

So I acknowledge my bias (and perhaps over-investment in one skill set). But the more I think about it, the more I feel that my skepticism is also justified by some real objective concerns, which I’d like to cover in this post.

Performance

One reason for my skepticism is that I just don’t think we’ve exhausted all the possibilities of making JavaScript tools faster. Marvin Hagemeister has done an excellent job of demonstrating this, by showing how much low-hanging fruit there is in ESLint, Tailwind, etc.

In the browser world, JavaScript has proven itself to be “fast enough” for most workloads. Sure, WebAssembly exists, but I think it’s fair to say that it’s mostly used for niche, CPU-intensive tasks rather than for building a whole website. So why are JavaScript-based CLI tools rushing to throw JavaScript away?

The big rewrite

I think the perf gap comes from a few different things. First, there’s the aforementioned low-hanging fruit – for a long time, the JavaScript tooling ecosystem has been focused on building something that works, not something fast. Now we’ve reached a saturation point where the API surface is mostly settled, and everyone just wants “the same thing, but faster.” Hence the explosion of new tools that are nearly drop-in replacements for existing ones: Rolldown for Rollup, Oxlint for ESLint, Biome for Prettier, etc.

However, these tools aren’t necessarily faster because they’re using a faster language. They could just be faster because 1) they’re being written with performance in mind, and 2) the API surface is already settled, so the authors don’t have to spend development time tinkering with the overall design. Heck, you don’t even need to write tests! Just use the existing test suite from the previous tool.

In my career, I’ve often seen a rewrite from A to B resulting in a speed boost, followed by the triumphant claim that B is faster than A. However, as Ryan Carniato points out, a rewrite is often faster just because it’s a rewrite – you know more the second time around, you’re paying more attention to perf, etc.

Bytecode and JIT

The second class of performance gaps comes from the things browsers give us for free, and that we rarely think about: the bytecode cache and JIT (Just-In-Time compiler).

When you load a website for the second or third time, if the JavaScript is cached correctly, then the browser doesn’t need to parse and compile the source code into bytecode anymore. It just loads the bytecode directly off disk. This is the bytecode cache in action.

Furthermore, if a function is “hot” (frequently executed), it will be further optimized into machine code. This is the JIT in action.

In the world of Node.js scripts, we don’t get the benefits of the bytecode cache at all. Every time you run a Node script, the entire script has to be parsed and compiled from scratch. This is a big reason for the reported perf wins between JavaScript and non-JavaScript tooling.

Thanks to the inimitable Joyee Cheung, though, Node is now getting a compile cache. You can set an environment variable and immediately get faster Node.js script loads:

export NODE_COMPILE_CACHE=~/.cache/nodejs-compile-cache

I’ve set this in my ~/.bashrc on all my dev machines. I hope it makes it into the default Node settings someday.

As for JIT, this is another thing that (sadly) most Node scripts can’t really benefit from. You have to run a function before it becomes “hot,” so on the server side, it’s more likely to kick in for long-running servers than for one-off scripts.

And the JIT can make a big difference! In Pinafore, I considered replacing the JavaScript-based blurhash library with a Rust (Wasm) version, before realizing that the performance difference was erased by the time we got to the fifth iteration. That’s the power of the JIT.

Maybe eventually a tool like Porffor could be used to do an AOT (Ahead-Of-Time) compilation of Node scripts. In the meantime, though, JIT is still a case where native languages have an edge on JavaScript.

I should also acknowledge: there is a perf hit from using Wasm versus pure-native tools. So this could be another reason native tools are taking the CLI world by storm, but not necessarily the browser frontend.

Contributions and debuggability

I hinted at it earlier, but this is the main source of my skepticism toward the “rewrite it all in native” movement.

JavaScript is, in my opinion, a working-class language. It’s very forgiving of types (this is one reason I’m not a huge TypeScript fan), it’s easy to pick up (compared to something like Rust), and since it’s supported by browsers, there is a huge pool of people who are conversant with it.

For years, we’ve had both library authors and library consumers in the JavaScript ecosystem largely using JavaScript. I think we take for granted what this enables.

For one: the path to contribution is much smoother. To quote Matteo Collina:

Most developers ignore the fact that they have the skills to debug/fix/modify their dependencies. They are not maintained by unknown demigods but by fellow developers.

This breaks down if JavaScript library authors are using languages that are different (and more difficult!) than JavaScript. They may as well be demigods!

For another thing: it’s straightforward to modify JavaScript dependencies locally. I’ve often tweaked something in my local node_modules folder when I’m trying to track down a bug or work on a feature in a library I depend on. Whereas if it’s written in a native language, I’d need to check out the source code and compile it myself – a big barrier to entry.

(To be fair, this has already gotten a bit tricky thanks to the widespread use of TypeScript. But TypeScript is not too far from the source JavaScript, so you’d be amazed how far you can get by clicking “pretty print” in the DevTools. Thankfully most Node libraries are also not minified.)

Of course, this also leads us back to debuggability. If I want to debug a JavaScript library, I can simply use the browser’s DevTools or a Node.js debugger that I’m already familiar with. I can set breakpoints, inspect variables, and reason about the code as I would for my own code. This isn’t impossible with Wasm, but it requires a different skill set.

Conclusion

I think it’s great that there’s a new generation of tooling for the JavaScript ecosystem. I’m excited to see where projects like Oxc and VoidZero end up. The existing incumbents are indeed exceedingly slow and would probably benefit from the competition. (I get especially peeved by the typical eslint + prettier + tsc + rollup lint+build cycle.)

That said, I don’t think that JavaScript is inherently slow, or that we’ve exhausted all the possibilities for improving it. Sometimes I look at truly perf-focused JavaScript, such as the recent improvements to the Chromium DevTools using mind-blowing techniques like using Uint8Arrays as bit vectors, and I feel that we’ve barely scratched the surface. (If you really want an inferiority complex, see other commits from Seth Brenith. They are wild.)

I also think that, as a community, we have not really grappled with what the world would look like if we relegate JavaScript tooling to an elite priesthood of Rust and Zig developers. I can imagine the average JavaScript developer feeling completely hopeless every time there’s a bug in one of their build tools. Rather than empowering the next generation of web developers to achieve more, we might be training them for a career of learned helplessness. Imagine what it will feel like for the average junior developer to face a segfault rather than a familiar JavaScript Error.

At this point, I’m a senior in my career, so of course I have little excuse to cling to my JavaScript security-blanket. It’s part of my job to dig down a few layers deeper and understand how every part of the stack works.

However, I can’t help but feel like we are embarking down an unknown path with unintended consequences, when there is another path that is less fraught and could get us nearly the same results. The current freight train shows no signs of slowing down, though, so I guess we’ll find out when we get there.

The greatness and limitations of the js-framework-benchmark

I love the js-framework-benchmark. It’s a true open-source success story – a shared benchmark, with contributions from various JavaScript framework authors, widely cited, and used to push the entire JavaScript ecosystem forward. It’s a rare marvel.

That said, the benchmark is so good that it’s sometimes taken as the One True Measure of a web framework’s performance (or maybe even worth!). But like any metric, it has its flaws and limitations. Many of these limitations are well-known among framework authors like myself, but aren’t widely known outside a small group of experts.

In this post, I’d like to both celebrate the js-framework-benchmark for its considerable achievements, while also highlighting some of its quirks and limitations.

The greatness

First off, I want to acknowledge the monumental work that Stefan Krause has put into the js-framework-benchmark. It’s practically a one-man show – if you look into the commit history, it’s clear that Stefan has shouldered the main burden of maintaining the benchmark over time.

This is not a simple feat! A recent subtle issue with Chrome 124 shows just how much work goes into keeping even a simple benchmark humming across major browser releases.

So I don’t want anything in this post to come across as an attack on Stefan or the js-framework-benchmark. I am the king of burning out on open-source projects (PouchDB, Pinafore), so I have no leg to stand on to criticize an open-source maintainer with such tireless dedication. I can only sit in awe of Stefan’s accomplishment. I’m humbled and grateful.

If anything, this post should underscore how utterly the benchmark has succeeded under Stefan’s stewardship. Despite its flaws (as any benchmark would have), the js-framework-benchmark has become almost synonymous with “JavaScript framework performance.” To me, this is almost entirely due to Stefan’s diligence and attention to detail. Under different leadership, the benchmark may have been forgotten by now.

So within that context, I’d like to talk about the things the benchmark doesn’t measure, as well as the things it measures slightly differently from how folks might expect.

What does the benchmark do exactly?

First off, we have to understand what the js-framework-benchmark actually tests.

Screenshot saying VanillaJS keyed and showing buttons like add 10k rows, swap rows, and clear rows. There are multiple rows of data in a table, with boilerplate random text in each one

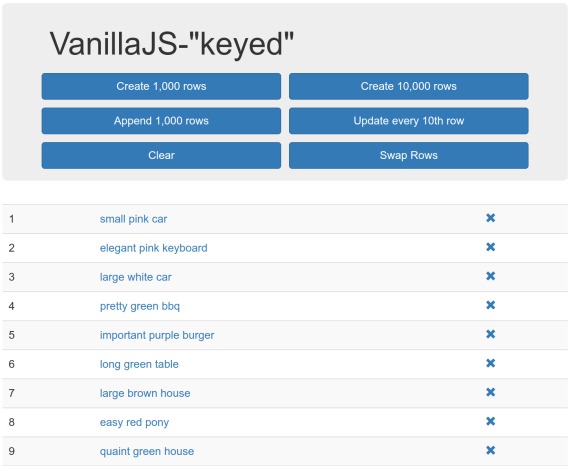
Screenshot of the vanillajs (i.e. baseline) “framework” in the js-framework-benchmark

To oversimplify, the core benchmark is:

  • Render a <table> with up to 10k rows
  • Add rows, mutate a row, remove rows, etc.

This is basically it. Frameworks are judged on how fast they can render 10k table rows, mutate a single row, swap some rows around, etc.

If this sounds like a very specific scenario, well… it kind of is. And this is where the main limitations of the benchmark come in. Let’s cover each one separately.

SSR and hydration

Most clearly, the js-framework-benchmark does not measure server-side rendering (SSR) or hydration. It is purely focused on client-side rendering (CSR).

This is fine, by the way! Plenty of web apps are pure-CSR Single-Page Apps (SPAs). And there are other benchmarks that do cover SSR, such as Marko’s isomorphic UI benchmarks.

This is just to say that, for frameworks that almost exclusively focus on the performance benefits they bring to SSR or hydration (such as Qwik or Astro), the js-framework-benchmark is not really going to tell you how they stack up to other frameworks. The main value proposition is just not represented here.

One big component

The js-framework-benchmark typically renders one big component. There are some exceptions, such as the vanillajs-wc “framework” using multiple web components. But in general, most of the frameworks you’ve heard of render one big component containing the entire table and all its rows and cells.

There is nothing inherently wrong with this. However, it means that any per-component overhead (such as the overhead inherent to web components, or the overhead of the framework’s component abstraction) is not captured in the benchmark. And of course, any future optimizations that frameworks might do to reduce per-component overhead will never win points on the js-framework-benchmark.

Again, this is fine. Sometimes the ideal implementation is “one big component.” However, it’s not very common, so this is something to be aware of when reading the benchmark results.

Optimized by framework authors

Framework authors are a competitive bunch. Even framework users are defensive about their chosen framework. So it’s no surprise that what you’re seeing in the js-framework-benchmark has been heavily optimized to put each framework in the best possible light.

Sometimes this is reasonable – after all, the benchmark should try to represent what a competent component author would write. In other cases… it’s more of a gray zone.

I don’t want to demonize any particular framework in this post. So I’m going to call out a few cases I’ve seen of this, including one from the framework I work on (LWC).

  • Svelte’s HTML was originally written in an awkward style designed to eliminate the overhead of inserting whitespace text nodes. To Svelte’s credit, the new Svelte v5 code does not have this issue.
  • Vue introduced the v-memo directive (at least in part) to improve their score on the js-framework-benchmark by minimizing the overhead of virtual DOM diffing in the “select row” test (i.e. updating one row out of 1k). However, this could be construed as unfair, since v-memo is an advanced directive that only performance-minded component authors are likely to use. Whereas other frameworks can be just as competitive with only idiomatic component authoring patterns.
  • Event delegation is a whole can of worms. Some frameworks (such as Solid and Svelte) do automatic event delegation, which boosts performance without requiring developer intervention. Other frameworks in the benchmark, such as Million and Lit, use manual delegation, which again is a bit unfair because it’s not something a component author will necessarily think to do. (The LWC component uses mild manual event delegation, by placing one listener on each row instead of two.) This can make a big difference in the benchmark, especially since the vanillajs “framework” (i.e. the baseline) uses event delegation, so you kind of have to do it to be truly competitive, unless you want to be penalized for adding 20k click listeners instead of one.

Again, none of this is necessarily good or bad. Event delegation is a worthy technique, v-memo is a great optimization for those who know to use it, and as a Svelte user I’ve even worked around the whitespace issue myself. Some of these points (such as event delegation) are even noted in the benchmark results. But I’d wager that most folks reading the benchmark are not aware of these subtleties.

10k rows is a lot

The benchmark renders 1k-10k table rows, with 7 elements inside each one. Then it tests mutating, removing, or swapping those rows.

Frameworks that do well on this scenario are (frankly) amazing. However, that doesn’t change the fact that this is a very weird scenario. If you are rendering 8k-80k DOM elements, then you should probably start thinking about pagination or virtualization (or at least content-visibility). Putting that many elements in the same component is also not something you see in most web apps.

Because this is such an atypical scenario, it also exaggerates the benefit of certain optimizations, such as the aforementioned event delegation. If you are attaching one event listener instead of 20k, then yes, you are going to be measurably faster. But should you really ever put yourself in a situation where you’re creating 20k event listeners on 80k DOM elements in the first place?

Chrome-only

One of my biggest pet peeves is when web developers only pay attention to Chrome while ignoring other browsers. Especially in performance discussions, statements like “Such-and-such DOM API is fast” or “The browser is slow at X,” where Chrome is merely implied, really irk me. This is something I railed against in my tenure on the Microsoft Edge team.

Focusing on one browser does kind of make sense in this case, though, since the js-framework-benchmark relies on some advanced Chromium APIs to run the tests. It also makes the results easier to digest, since there’s only one browser in play.

However, Chrome is not the only browser that exists (a fact that may surprise some web developers). So it’s good to be aware that this benchmark has nothing to say about Firefox or Safari performance.

Only measuring re-renders

As mentioned above, the js-framework-benchmark measures client-side rendering. Bundle size and memory usage are tracked as secondary measures, but they are not the main thing being measured, and I rarely see them mentioned. For most people, the runtime metrics are the benchmark.

Additionally, the bootstrap cost of a framework – i.e. the initial cost to execute the framework code itself – is not measured. Combine this with the lack of SSR/hydration coverage, and the js-framework-benchmark probably cannot tell you if a framework will tank your Largest Contentful Paint (LCP) or Total Blocking Time (TBT) scores, since it does not measure the first page load.

However, this lack of coverage for first-render goes even deeper. To avoid variance, the js-framework-benchmark does 5 “warmup” iterations before most tests. This means that many more first-render costs are not measured:

  • Pre-JITed (Just-In-Time compilation) performance
  • Initial one-time framework costs

For those unaware, JavaScript engines will JIT any code that they detect as “hot” (i.e. frequently executed). By doing 5 warmup iterations, we effectively skip past the pre-JITed phase and measure the JITed code directly. (This is also called “peak performance.”) However, the JITed performance is not necessarily what your users are experiencing, since every user has to experience the pre-JITed code before they can get to the JIT!

This second point above is also important. As mentioned in a previous post, lots of next-gen frameworks use a pattern where they set the innerHTML on a <template> once and then use cloneNode(true) after that. If you profile the js-framework-benchmark, you will find that this initial innerHTML (aka “Parse HTML”) cost is never measured, since it’s part of the one-time setup costs that occur during the “warmup” iterations. This gives these frameworks a slight advantage, since setting innerHTML (among other one-time setup costs) can be expensive.

Putting all this together, I would say that the js-framework-benchmark is comparable to the old DBMon benchmark – it is measuring client-side-heavy scenarios with frequent re-renders. (Think: a spreadsheet app, data dashboard, etc.) This is definitely not a typical use case, so if you are choosing your framework based on the js-framework-benchmark, you may be sorely disappointed if your most important perf metric is LCP, or if your SPA navigations tend to re-render the page from scratch rather than only mutate small parts of the page.

Conclusion

The js-framework-benchmark is amazing. It’s great that we have it, and I have personally used it to track performance improvements in LWC, and to gauge where we stack up against other frameworks.

However, the benchmark is just what it is: a benchmark. It is not real-world user data, it is not data from your own website or web app, and it does not cover every possible definition of the word “performance.”

Like all microbenchmarks, the js-framework-benchmark is useful for some things and completely irrelevant for others. However, because it is so darn good (rare for a microbenchmark!), it has often been taken as gospel, as the One True Measure of a framework’s speed (or its worth).

However, the fault does not really lie with the js-framework-benchmark. It is on us – the web developer community – to write other benchmarks to cover the scenarios that the js-framework-benchmark does not. It’s also on us framework authors to educate framework consumers (who might not have all this arcane knowledge!) about what a benchmark can tell you and what it cannot tell you.

In the browser world, we have several benchmarks: Speedometer, MotionMark, Kraken, SunSpider, Octane, etc. No one would argue that any of these are the One True Benchmark (although Speedometer comes close) – they all measure different things and are useful in different ways. My wish is that someday we could say the same for JavaScript framework benchmarks.

In the meantime, I will continue using and celebrating the js-framework-benchmark, while also being mindful that it is not the final word on web framework performance.

Web components are okay

Every so often, the web development community gets into a tizzy about something, usually web components. I find these fights tiresome, but I also see them as a good opportunity to reach across “the great divide” and try to find common ground rather than another opportunity to dunk on each other.

Ryan Carniato started the latest round with “Web Components Are Not the Future”. Cory LaViska followed up with “Web Components Are Not the Future — They’re the Present”. I’m not here to escalate, though – this is a peace mission.

I’ve been an avid follower of Ryan Carniato’s work for years. This post and the steady climb of LWC on the js-framework-benchmark demonstrate that I’ve been paying attention to what he has to say, especially about performance and framework design. The guy has single-handedly done more to move the web framework ecosystem forward in the past 5 years than anyone else I can think of.

That said, I also heavily work with web components, both on the framework side and as a component author. I’ve participated in the Web Components Community Group and Accessibility Object Model group, and I’ve written extensively on shadow DOM, custom elements, and web component accessibility in this blog.

So obviously I’m going to be interested when I see a post from Ryan Carniato on web components. And it’s a thought-provoking post! But I also think he misses the mark on a few things. So let’s dive in:

Performance

[T]he fundamental problem with Web Components is that they are built on Custom Elements.

[…] [E]very interface needs to go through the DOM. And of course this has a performance overhead.

This is completely true. If your goal is to build the absolute fastest framework you can, then you want to minimize DOM nodes wherever possible. This means that web components are off the table.

I fully believe that Ryan knows how to build the fastest possible framework. Again, the results for Solid on the js-framework-benchmark are a testament to this.

That said – and I might alienate some of my friends in the web performance community by saying this – performance isn’t everything. There are other tradeoffs in software development, such as maintainability, security, usability, and accessibility. Sometimes these things come into conflict.

To make a silly example: I could make DOM rendering slightly faster by never rendering any aria-* attributes. But of course sometimes you have to render aria-* attributes to make your interface accessible, and nobody would argue that a couple milliseconds are worth excluding screen reader users.

To make an even sillier example: you can improve performance by using for loops instead of .forEach(). Or using var instead of const/let. Typically, though, these kinds of micro-optimizations are just not worth it.

When I see this kind of stuff, I’m reminded of speedrunners trying to shave milliseconds off a 5-minute run of Super Mario Bros using precise inputs and obscure glitches. If that’s your goal, then by all means: backwards long jump across the entire stage instead of just having Mario run forward. I’ll continue to be impressed by what you’re doing, but it’s just not for me.

Minimizing the use of DOM nodes is a classic optimization – this is the main idea behind virtualization. That said, sometimes you can get away with simpler approaches, even if it’s not the absolute fastest option. I’d put “components as elements” in the same bucket – yes it’s sub-optimal, but optimal is not always the goal.

Similarly, I’ve long argued that it’s fine for custom elements to use different frameworks. Sometimes you just need to gradually migrate from Framework A to Framework B. Or you have to compose some micro-frontends together. Nobody would argue that this is the fastest possible interface, but fine – sometimes tradeoffs have to be made.

Having worked for a long time in the web performance space, I find that the lowest-hanging fruit for performance is usually something dumb like layout thrashing, network waterfalls, unnecessary re-renders, etc. Framework authors like myself love to play performance golf with things like the js-framework-benchmark, and it’s a great flex, but it just doesn’t usually matter in the real world.

That said, if it does matter to you – if you’re building for resource-constrained environments where every millisecond counts: great! Ditch web components! I will geek out and cheer for every speedrunning record you break.

The cost of standards

More code to ship and more code to execute to check these edge cases. It’s a hidden tax that impacts everyone.

Here’s where I completely get off the train from Ryan’s argument. As a framework author, I just don’t find that it’s that much effort to support web components. Detecting props versus attributes is a simple prop in element check. Outputting web components is indeed painful, but hey – nobody said you have to do it. Vue 2 got by with a standalone web component wrapper library, and Remount exists without any input from the React team.

As a framework author, if you want to freeze your thinking in 2011 and code as if nothing new was added to the web platform since then, you absolutely can! And you can still write a great framework! This is the beauty of the web. jQuery v1 is still chugging away on plenty of websites, and in fact it gets faster and faster with every new browser release, since browser perf teams are often targeting whatever patterns web developers used ~5 year ago in an endless cat-and-mouse game.

But assuming you don’t want to freeze your brain in amber, then yes: you do need to account for new stuff added to the web platform. But this is also true of things like Symbols, Proxys, Promises, etc. I just see it as part of the job, and I’m not particularly bothered, since I know that whatever I write will still work in 10 years, thanks to the web’s backwards compatibility guarantees.

Furthermore, I get the impression that a wide swath of the web development community does not care about web components, does not want to support them, and you probably couldn’t convince them to. And that’s okay! The web is a big tent, and you can build entire UIs based on web components, or with a sprinkling of HTML web components, or with none at all. If you want to declare your framework a “no web components” zone, then you can do that and still get plenty of avid fans.

That said, Ryan is right that, by blessing something as “the standard,” it inherently becomes a mental default that needs to be grappled with. Component authors must decide whether their <slot>s should work like native <slot>s. That’s true, but again, you could say this about a lot of new browser APIs. You have to decide whether IntersectionObserver or <img loading="lazy"> is worth it, or whether you’d rather write your own abstraction. That’s fine! At least we have a common point of reference, a shared vocabulary to compare and contrast things.

And just because something is a web standard doesn’t mean you have to use it. For the longest time, the classic joke about JavaScript: The Good Parts was how small it is compared to JavaScript: The Definitive Guide. The web is littered with deprecated (but still supported) APIs like document.domain, with, and <frame>s. Take it or leave it!

Conclusion

[I]n a sense there are nothing wrong with Web Components as they are only able to be what they are. It’s the promise that they are something that they aren’t which is so dangerous.

Here I totally agree with Ryan. As I’ve said before, web components are bad at a lot of things – Server-Side Rendering, accessibility, even interop in some cases. They’re good at plenty of things, but replacing all JavaScript frameworks is not one of them. Maybe we can check back in 10 years, but for now, there are still cases where React, Solid, Svelte, and friends shine and web components flounder.

Ryan is making an eminently reasonable point here, as is the rest of the post, and on its own it’s a good contribution to the discourse. The title is a bit inflammatory, which leads people to wield it as a bludgeon against their perceived enemies on social media (likely without reading the piece), but this is something I blame on social media, not on Ryan.

Again, I find these debates a bit tiresome. I think the fundamental issue, as I’ve previously said, is that people are talking past each other because they’re building different things with different constraints. It’s as if a salsa dancer criticized ballet for not being enough like salsa. There is more than one way to dance!

From my own personal experience: at Salesforce, we build a client-rendered app, with its own marketplace of components, with strict backwards-compatibility guarantees, where the intended support is measured in years if not decades. Is this you? If not, then maybe you shouldn’t build your entire UI out of web components, with shadow DOM and the whole kit-n-kaboodle. (Or maybe you should! I can’t say!)

What I find exciting about the web is the sheer number of people doing so many wild and bizarre things with it. It has everything from games to art projects to enterprise SaaS apps, built with WebGL and Wasm and Service Workers and all sorts of zany things. Every new capability added to the web platform isn’t a limitation on your creativity – it’s an opportunity to express your creativity in ways that nobody imagined before.

Web components may not be the future for you – that’s great! I’m excited to see what you build, and I might steal some ideas for my own corner of the web.

Update: Be sure to read Lea Verou’s and Baldur Bjarnason’s excellent posts on the topic.

Improving rendering performance with CSS content-visibility

Recently I got an interesting performance bug on emoji-picker-element:

I’m on a fedi instance with 19k custom emojis […] and when I open the emoji picker […], the page freezes for like a full second at least and overall performance stutters for a while after that.

If you’re not familiar with Mastodon or the Fediverse, different servers can have their own custom emoji, similar to Slack, Discord, etc. Having 19k (really closer to 20k in this case) is highly unusual, but not unheard of.

So I booted up their repro, and holy moly, it was slow:

Screenshot of Chrome DevTools with an emoji picker showing high ongoing layout/paint costs and 40,000 DOM nodes

There were multiple things wrong here:

  • 20k custom emoji meant 40k elements, since each one used a <button> and an <img>.
  • No virtualization was used, so all these elements were just shoved into the DOM.

Now, to my credit, I was using <img loading="lazy">, so those 20k images were not all being downloaded at once. But no matter what, it’s going to be achingly slow to render 40k elements – Lighthouse recommends no more than 1,400!

My first thought, of course, was, “Who the heck has 20k custom emoji?” My second thought was, “*Sigh* I guess I’m going to need to do virtualization.”

I had studiously avoided virtualization in emoji-picker-element, namely because 1) it’s complex, 2) I didn’t think I needed it, and 3) it has implications for accessibility.

I’ve been down this road before: Pinafore is basically one big virtual list. I used the ARIA feed role, did all the calculations myself, and added an option to disable “infinite scroll,” since some people don’t like it. This is not my first rodeo! I was just grimacing at all the code I’d have to write, and wondering about the size impact on my “tiny” ~12kB emoji picker.

After a few days, though, the thought popped into my head: what about CSS content-visibility? I saw from the trace that lots of time is spent in layout and paint, and plus this might help the “stuttering.” This could be a much simpler solution than full-on virtualization.

If you’re not familiar, content-visibility is a new-ish CSS feature that allows you to “hide” certain parts of the DOM from the perspective of layout and paint. It largely doesn’t affect the accessibility tree (since the DOM nodes are still there), it doesn’t affect find-in-page (+F/Ctrl+F), and it doesn’t require virtualization. All it needs is a size estimate of off-screen elements, so that the browser can reserve space there instead.

Luckily for me, I had a good atomic unit for sizing: the emoji categories. Custom emoji on the Fediverse tend to be divided into bite-sized categories: “blobs,” “cats,” etc.

Screenshot of emoji picker showing categories Bobs and Cats with different numbers of emoji in each but with eight columns in a grid for all

Custom emoji on mastodon.social.

For each category, I already knew the emoji size and the number of rows and columns, so calculating the expected size could be done with CSS custom properties:

.category {
  content-visibility: auto;
  contain-intrinsic-size:
    /* width */
    calc(var(--num-columns) * var(--total-emoji-size))
    /* height */
    calc(var(--num-rows) * var(--total-emoji-size));
}

These placeholders take up exactly as much space as the finished product, so nothing is going to jump around while scrolling.

The next thing I did was write a Tachometer benchmark to track my progress. (I love Tachometer.) This helped validate that I was actually improving performance, and by how much.

My first stab was really easy to write, and the perf gains were there… They were just a little disappointing.

For the initial load, I got a roughly 15% improvement in Chrome and 5% in Firefox. (Safari only has content-visibility in Technology Preview, so I can’t test it in Tachometer.) This is nothing to sneeze at, but I knew a virtual list could do a lot better!

So I dug a bit deeper. The layout costs were nearly gone, but there were still other costs that I couldn’t explain. For instance, what’s with this big undifferentiated blob in the Chrome trace?

Screenshot of Chrome DevTools with large block of JavaScript time called "mystery time"

Whenever I feel like Chrome is “hiding” some perf information from me, I do one of two things: bust out chrome:tracing, or (more recently) enable the experimental “show all events” option in DevTools.

This gives you a bit more low-level information than a standard Chrome trace, but without needing to fiddle with a completely different UI. I find it’s a pretty good compromise between the Performance panel and chrome:tracing.

And in this case, I immediately saw something that made the gears turn in my head:

Screenshot of Chrome DevTools with previous mystery time annotated as ResourceFetcher::requestResource

What the heck is ResourceFetcher::requestResource? Well, even without searching the Chromium source code, I had a hunch – could it be all those <img>s? It couldn’t be, right…? I’m using <img loading="lazy">!

Well, I followed my gut and simply commented out the src from each <img>, and what do you know – all those mystery costs went away!

I tested in Firefox as well, and this was also a massive improvement. So this led me to believe that loading="lazy" was not the free lunch I assumed it to be.

Update: I filed a bug on Chromium for this issue. After more testing, it seems I was mistaken about Firefox – this looks like a Chromium-only issue.

At this point, I figured that if I was going to get rid of loading="lazy", I may as well go whole-hog and turn those 40k DOM elements into 20k. After all, if I don’t need an <img>, then I can use CSS to just set the background-image on an ::after pseudo-element on the <button>, cutting the time to create those elements in half.

.onscreen .custom-emoji::after {
  background-image: var(--custom-emoji-background);
}

At this point, it was just a simple IntersectionObserver to add the onscreen class when the category scrolled into view, and I had a custom-made loading="lazy" that was much more performant. This time around, Tachometer reported a ~40% improvement in Chrome and ~35% improvement in Firefox. Now that’s more like it!

Note: I could have used the contentvisibilityautostatechange event instead of IntersectionObserver, but I found cross-browser differences, and plus it would have penalized Safari by forcing it to download all the images eagerly. Once browser support improves, though, I’d definitely use it!

I felt good about this solution and shipped it. All told, the benchmark clocked a ~45% improvement in both Chrome and Firefox, and the original repro went from ~3 seconds to ~1.3 seconds. The person who reported the bug even thanked me and said that the emoji picker was much more usable now.

Something still doesn’t sit right with me about this, though. Looking at the traces, I can see that rendering 20k DOM nodes is just never going to be as fast as a virtualized list. And if I wanted to support even bigger Fediverse instances with even more emoji, this solution would not scale.

I am impressed, though, with how much you get “for free” with content-visibility. The fact that I didn’t need to change my ARIA strategy at all, or worry about find-in-page, was a godsend. But the perfectionist in me is still irritated by the thought that, for maximum perf, a virtual list is the way to go.

Maybe eventually the web platform will get a real virtual list as a built-in primitive? There were some efforts at this a few years ago, but they seem to have stalled.

I look forward to that day, but for now, I’ll admit that content-visibility is a good rough-and-ready alternative to a virtual list. It’s simple to implement, gives a decent perf boost, and has essentially no accessibility footguns. Just don’t ask me to support 100k custom emoji!

The continuing tragedy of emoji on the web

Pop quiz: what emoji do you see below? [1]

Depending on your browser and operating system, you might see:

Three emoji representations of Martinique - the new black-red-green flag, the old blue-and-white flag, and the letters MQ.

From left to right: Safari on iOS 17, Firefox 130 on Windows 11, and Chrome 128 on Windows 11.

This, frankly, is a mess. And it’s emblematic of how half-heartedly browsers and operating systems have worked to keep their emoji up to date.

What’s responsible for this sorry state? I gave an overview two years ago, and shockingly little has changed – in fact, it’s gotten a bit worse.

In short:

  • Firefox bundles their own emoji font (great!), but unfortunately, thanks to turmoil at Twitter/X, their bet on Twemoji has not shaken out too well, and they are two years behind the latest Unicode standard.
  • Windows 10 users (i.e. 64% of Windows as a whole) are stuck five years behind in emoji versions, and even Windows 11 is still not showing flag emoji, which Microsoft excludes for some mysterious reason. (Geopolitical skittishness? Disregard for sports fans?)
  • Safari has the same fragmentation problem, with multiple users stuck on old versions of iOS, and thus old emoji fonts. For example, some 3.75% of iOS users are still on iOS 15, with only 2022-era emoji. [2]

As a result, every website on the planet that cares about having a consistent emoji experience has to bundle their own font or spritesheet, wasting untold megabytes for something that’s been standardized like clockwork by the Unicode Consortium for 15 years.

My recommendation remains the same: browsers should bundle their own emoji font and ship it outside of OS updates. Firefox does this right; they just need to switch to an up-to-date font like this Twemoji fork. There is an issue on Chromium to add the same functionality. As for Safari, well… they’re not quite evergreen, and fragmentation is just a consequence of that. But shipping a font is not rocket science, so maybe WebKit or iOS could be convinced to ship it out-of-band.

In the meantime, web developers can use a COLR font or polyfill to get a reasonably consistent experience across browsers. It’s just sad to me that, with all the stunning advancements browsers have made in recent years, and with all the overwhelming popularity of emoji, the web still struggles at rendering them.

Footnotes

  1. I’m using Codepen for this because WordPress automatically replaces native emoji with <img>s, since of course browsers can’t be trusted to render a font properly. Although ironically, they render the old flag (on certain browsers anyway): 🇲🇶
  2. For posterity: using Wikimedia’s stats for August 12th through September 16th 2024: 1.2% mobile Safari 15 users / 32% mobile Safari users = 3.75%.

Reliable JavaScript benchmarking with Tachometer

Writing good benchmarks is hard. Even if you grasp the basics of performance timings and measurements, it’s easy to fool yourself:

  • You weren’t measuring what you thought you were measuring.
  • You got the answer you wanted, so you stopped looking.
  • You didn’t clean state between tests, so you were just measuring the cache.
  • You didn’t understand how JavaScript engines work, so it optimized away your code.

Et cetera, et cetera. Anyone who’s been doing web performance long enough probably has a story about how they wrote a benchmark that gave them some satisfying result, only to realize later that they flubbed some tiny detail that invalidated the whole thing. It can be crushing.

For years now, though, I’ve been using Tachometer for most browser-based benchmarks. It’s featured in this blog a few times, although I’ve never written specifically about it.

Tachometer doesn’t make benchmarking totally foolproof, but it does automate a lot of the trickiest bits. What I like best is that it:

  1. Runs iterations until it reaches statistical significance.
  2. Alternates between two scenarios in an interleaved fashion.
  3. Launches a fresh browser profile between each iteration.

To be concrete, let’s say you have two scenarios you want to test: A and B. For Tachometer, these can simply be two web pages:

<!-- a.html -->
<script>
  scenarioA()
</script>
<!-- b.html -->
<script>
  scenarioB()
</script>

The only requirement is that you have something to measure, e.g. a performance measure:

function scenarioA() { // or B
  performance.mark('start')
  doStuff()
  performance.measure('total', 'start')
}

Now let’s say you want to know whether scenarioA or scenarioB is faster. Tachometer will essentially do the following:

  1. Load a.html.
  2. Load b.html.
  3. Repeat steps 1-2 until reaching statistical confidence that A and B are different enough (e.g. 1% different, 10% different, etc.).

This has several nice properties:

  1. Environment-specific variance is removed. Since you’re running A and B at the same time, on the same machine, in an interleaved fashion, it’s very unlikely that some environmental quirk will cause A to be artificially different from B.
  2. You don’t have to guess how many iterations are “enough” – the statistical test does that for you.
  3. The browser is fresh between each iteration, so you’re not just measuring cached/JITed performance.

That said, there are several downsides to this approach:

  1. The less different A and B are, the longer the tool will take to tell you that there’s no difference. In a CI environment, this is basically a nonstarter, because 99% of PRs don’t affect performance, and you don’t want to spend hours of CI time just to find out that updating the README didn’t regress anything.
  2. As mentioned, you’re not measuring JITed time. Sometimes you want to measure that, though. In that case, you have to run your own iterations-within-iterations (e.g. a for-loop) to avoid measuring the pre-JITed time.
  3. …Which you may end up doing anyway, because the tool tends to work best when your iterations take a large enough chunk of time. In my experience, a minimum of 50ms is preferable, although throttling can help you get there.

Tachometer also lacks any kind of visualization of performance changes over time, although there is a good GitHub action that can report the difference between a PR and your main branch. (Although again, you might not want to run it on every PR.)

The way I typically use Tachometer is to run one-off benchmarks, for instance when I’m doing some kind of cross-browser performance analysis. I often generate the config files rather than hand-authoring them, since they can be a bit repetitive.

Also, I only use Tachometer for browser or JavaScript tests – for anything else, I’d probably look into Hyperfine. (Haven’t used it, but heard good things about it.)

Tachometer has served me well for a long time, and I’m a big fan. The main benefit I’ve found is just the consistency of its results. I’ve been surprised how many times it’s consistently reported some odd regression (even in the ~1% range), which I can then track down with a git bisect to find the culprit. It’s also great for validating (or debunking) proposed perf optimizations.

Like any tool, Tachometer definitely has its flaws, and it’s still possible to fool yourself with it. But until I find a better tool, this is my go-to for low-level JavaScript microbenchmarks.

Bonus tip: running Tachometer in --manual mode with the DevTools performance tab is a great way to validate that you’re measuring what you think you’re measuring. Pay attention to the “User Timings” section to ensure your timings line up with what you expect.

Is it okay to make connectedCallback async?

One question I see a lot about web components is whether this is okay:

async connectedCallback() {
  const response = await fetch('/data.json')
  const data = await response.json()
  this._data = data
}

The answer is: yes. It’s fine. Go ahead and make your connectedCallbacks async. Thanks for reading.

What? You want a longer answer? Most people would have tabbed over to Reddit by now, but sure, no problem.

The important thing to remember here is that an async function is just a function that returns a Promise. So the above is equivalent to:

connectedCallback() {
  return fetch('/data.json')
    .then(response => response.json())
    .then(data => {
      this._data = data
    })
}

Note, though, that the browser expects connectedCallback to return undefined (or void for you TypeScript-heads). The same goes for disconnectedCallback, attributeChangedCallback, and friends. So the browser is just going to ignore whatever you return from those functions.

The best argument against using this pattern is that it kinda-sorta looks like the browser is going to treat your async function differently. Which it definitely won’t.

For example, let’s say you have some setup/teardown logic:

async connectedCallback() {
  await doSomething()
  window.addEventListener('resize', this._onResize)
}

async disconnectedCallback() {
  await undoSomething()
  window.removeEventListener('resize', this._onResize)
}

You might naïvely think that the browser is going to run these callbacks in order, e.g. if the component is quickly connected and disconnected:

div.appendChild(component)
div.removeChild(component)

However, it will actually run the callbacks synchronously, with any async operations as a side effect. So in the above example, the awaits might resolve in a random order, causing a memory leak due to the dangling resize listener.

So as an alternative, you might want to avoid async connectedCallback just to make it crystal-clear that you’re using side effects:

connectedCallback() {
  (async () => {
      const response = await fetch('/data.json')
      const data = await response.json()
      this._data = data
  })()
}

To me, though, this is ugly enough that I’ll just stick with async connectedCallback. And if I really need my async functions to execute sequentially, I might use the sequential Promise pattern or something.

Bugs I’ve filed on browsers

I think filing bugs on browsers is one of the most useful things a web developer can do.

When faced with a cross-browser compatibility problem, a lot of us are conditioned to just search for some quick workaround, or to keep cycling through alternatives until something works. And this is definitely what I did earlier in my career. But I think it’s too short-sighted.

Browser dev teams are just like web dev teams – they have priorities and backlogs, and they sometimes let bugs slip through. Also, a well-written bug report with clear steps-to-repro can often lead to a quick resolution – especially if you manage to nerd-snipe some bored or curious engineer.

As such, I’ve filed a lot of bugs on browsers over the years. For whatever reason – stubbornness, frustration, some highfalutin sense of serving the web at large – I’ve made a habit of nagging browser vendors about whatever roadblock I’m hitting that day. And they often fix it!

So I thought it might be interesting to do an analysis of the bugs I’ve filed on the major browser engines – Chromium, Firefox, and WebKit – over my roughly 10-year web development career. I’ve excluded older and lesser-known browser engines that I never filed bugs on, and I’ve also excluded Trident/EdgeHTML, since the original “Microsoft Connect” bug tracker seems to be offline. (Also, I was literally paid to file bugs on EdgeHTML for a good 2 years, so it’s kind of unfair.)

Some notes about this data set, before people start drawing conclusions:

  • Chromium is a bit over-represented, because I tend to use Chromedriver-related tools (e.g. Puppeteer) a lot more than other browser automation tools.
  • WebKit is kind of odd in that a lot of these bugs turned out to be in proprietary Apple systems (Safari, iOS, etc.) rather than WebKit proper. (At least, this is what I assume the enigmatic rdar:// response means. [1])
  • I excluded one bug from Firefox that was actually on MDN (which uses the same bug tracker).

The data

So without further ado, here is the data set:

Browser Filed Open Fixed Invalid Fixed%
Chromium 27 4 14 9 77.78%
Firefox 18 3 8 7 72.73%
WebKit 25 6 12 7 66.67%
Total 70 13 34 23 72.34%

Notes: For “Invalid,” I’m being generous and including “duplicate,” “obsolete,” “wontfix,” etc. For “Fixed%,” I’m counting only the number fixed as a proportion of valid bugs.

Some things that jump out at me from the data set:

  • The “Fixed%” is pretty similar for all three browsers, although WebKit’s is a bit lower. When I look at the unfixed WebKit bugs, 2 are related to iOS rather than WebKit, one is in WebSQL (RIP), and the remaining 3 are honestly pretty minor. So I can’t really blame the WebKit team. (And one of those minor issues wound up in Interop 2024, so it may get fixed soon.)
  • For the 3 open Firefox issues, 2 of them are quite old and have terrible steps-to-repro (mea culpa), and the remaining one is a minor CSS issue related to shadow DOM.
  • For the 4 open Chromium issues, one of them is actually obsolete (I pinged the thread), 2 are quite minor, and the remaining one is partially fixed (it works when BFCache is enabled).
  • I was surprised that the total number of bugs filed on Firefox wasn’t even lower. My hazy memory was that I had barely filed any bugs on Firefox, and when I did, it usually turned out that they were following the spec but the other browsers weren’t. (I learned to really triple-check my work before filing bugs on them!)
  • 6 of the bugs I filed on WebKit were for IndexedDB, which definitely matches my memory of hounding them with bug reports for IDB. (In comparison, I filed 3 IDB bugs on Chromium and 0 on Firefox.)
  • As expected, 5 issues I filed on Chromium were due to ChromeDriver, DevTools, etc.

If you’d like to peruse the raw data, it can be found below:

Chromium data
Status ID Title Date
Fixed 41495645 Chromium leaks Document/Window/etc. when navigating in multi-page site using CDP-based heapsnapshots Feb 22, 2024 01:02AM
New 40890306 Reflected ARIA properties should not treat setting undefined the same as null Mar 2, 2024 05:50PM
New 40885158 Setting outerHTML on child of DocumentFragment throws error Jan 8, 2024 10:52PM
Fixed 40872282 aria-label on a should be ignored for accessible name calculation Jan 8, 2024 11:24PM
Duplicate 40229331 Style calculation takes much longer for multiple s vs one big Jun 20, 2023 09:14AM
Fixed 40846966 customElements.whenDefined() resolves with undefined instead of constructor Jan 8, 2024 10:13PM
Fixed 40827056 ariaInvalid property not reflected to/from aria-invalid attribute Jan 8, 2024 08:33PM
Obsolete 40767620 Heap snapshot includes objects referenced by DevTools console Jan 8, 2024 11:53PM
New 40766136 Restoring selection ranges causes text input to ignore keypresses Jan 8, 2024 07:20PM
Fixed 40759641 Poor style calculation performance for attribute selectors compared to class selectors May 5, 2021 01:40PM
Obsolete 40149430 performance.measureMemory() disallowed in headless mode Feb 27, 2023 12:26AM
Obsolete 40704787 Add option to disable WeakMap keys and circular references in Retainers graph Jan 8, 2024 05:52PM
Fixed 40693859 Chrome crashes due to WASM file when DevTools are recording trace Jun 24, 2020 07:20AM
Fixed 40677812 npm install chrome-devtools-frontend fails due to preinstall script Jan 8, 2024 05:17PM
New 40656738 Navigating back does not restore focus to clicked element Jan 8, 2024 03:26PM
Obsolete 41477958 Compositor animations recalc style on main thread every frame with empty requestAnimationFrame Aug 29, 2019 04:06AM
Duplicate 41476815 OffscreenCanvas convertToBlob() is >300ms slower than Feb 18, 2020 11:51PM
Fixed 41475186 Insertion and removal of overflow:scroll element causes large style calculation regression Aug 26, 2019 01:34AM
Obsolete 41354172 IntersectionObserver uses root’s padding box rather than border box Nov 12, 2018 09:43AM
Obsolete 41329253 word-wrap:break-word with odd Unicode characters causes long layout Jul 11, 2017 01:50PM
Fixed 41327511 IntersectionObserver boundingClientRect has inaccurate width/height Jun 1, 2019 08:28PM
Fixed 41267419 Chrome 52 sends a CORS preflight request with an empty Access-Control-Request-Headers when all author headers are CORS-safelisted Mar 18, 2017 02:27PM
Fixed 41204713 IndexedDB blocks DOM rendering Jan 24, 2018 04:03PM
Fixed 41189720 chrome://inspect/#devices flashing “Pending authorization” for Android device Oct 5, 2015 03:59AM
Obsolete 41154786 Chrome for iOS: openDatabase causes DOM Exception 11 or 18 Feb 9, 2015 08:30AM
Fixed 41151574 Empty IndexedDB blob causes 404 when fetched with ajax Mar 16, 2015 11:37AM
Fixed 40400696 Blob stored in IndexedDB causes null result from FileReader Feb 9, 2015 10:34AM
Firefox data
ID Summary Resolution Updated
1704551 Poor style calculation performance for attribute selectors compared to class selectors FIXE 2021-09-02
1861201 Support ariaBrailleLabel and ariaBrailleRoleDescription reflection FIXE 2024-02-20
1762999 Intervening divs with ids reports incorrect listbox options count to NVDA FIXE 2023-10-10
1739154 delegatesFocus changes focused inner element when host is focused FIXE 2022-02-08
1707116 Replacing shadow DOM style results in inconsistent computed style FIXE 2021-05-10
1853209 ARIA reflection should treat setting null/undefined as removing the attribute FIXE 2023-10-20
1208840 IndexedDB blocks DOM rendering 2022-10-11
1531511 Service Worker fetch requests during ‘install’ phase block fetch requests from main thread 2022-10-11
1739682 Bare ::part(foo) CSS selector selects parts inside shadow roots 2024-02-20
1331135 Performance User Timing entry buffer restricted to 150 DUPL 2019-03-13
1699154 :focus-visible – JS-based focus() on back nav treated as keyboard input FIXE 2021-03-19
1449770 position:sticky inside of position:fixed does’t async-scroll in Firefox for Android (and asserts in ActiveScrolledRoot::PickDescendant() in debug build) WORK 2023-02-23
1287221 WebDriver:Navigate results in slower performance.timing metrics DUPL 2023-02-09
1536717 document.scrollingElement.scrollTop is incorrect DUPL 2022-01-10
1253387 Safari does not support IndexedDB in a worker FIXE 2016-03-17
1062368 Ajax requests for blob URLs return 0 as .status even if the load succeeds DUPL 2014-09-04
1081668 Blob URL returns xhr.status of 0 DUPL 2015-02-25
1711057 :focus-visible does not match for programmatic keyboard focus after mouse click FIXE 2021-06-09
1471297 fetch() and importScripts() do not share HTTP cache WORK 2021-03-17
WebKit data
ID Resolution Summary Changed
225723 Restoring selection ranges causes text input to ignore keypresses 2023-02-26
241704 Preparser does not download stylesheets before running inline scripts 2022-06-23
263663 Support ariaBrailleLabel and ariaBrailleRoleDescription reflection 2023-11-01
260716 FIXE adoptedStyleSheets (ObservableArray) has non-writable length 2023-09-03
232261 FIXE :host::part(foo) selector does not select elements inside shadow roots 2021-11-04
249420 DUPL :host(.foo, .bar) should be an invalid selector 2023-08-07
249737 FIXE Setting outerHTML on child of DocumentFragment throws error 2023-07-15
251383 INVA Reflected ARIA properties should not treat setting undefined the same as null 2023-10-25
137637 Null character causes early string termination in Web SQL 2015-04-25
202655 iOS Safari: timestamps can be identical for consecutive rAF callbacks 2019-10-10
249943 Emoji character is horizontally misaligned when using COLR font 2023-01-04
136888 FIXE IndexedDB onupgradeneeded event has incorrect value for oldVersion 2019-07-04
137034 FIXE Completely remove all IDB properties/constructors when it is disabled at runtime 2015-06-08
149953 FIXE Modern IDB: WebWorker support 2016-05-11
151614 FIXE location.origin is undefined in a web worker 2015-11-30
156048 FIXE We sometimes fail to remove outdated entry from the disk cache after revalidation and when the resource is no longer cacheable 2016-04-05
137647 FIXE Fetching Blob URLs with XHR gives null content-type and content-length 2017-06-07
137756 INVA WKWebView: JavaScript fails to load, apparently due to decoding error 2014-10-20
137760 DUPL WKWebView: openDatabase results in DOM Exception 18 2016-04-27
144875 INVA WKWebView does not persist IndexedDB data after app close 2015-05-28
149107 FIXE IndexedDB does not throw ConstraintErrors for unique keys 2016-03-21
149205 FIXE IndexedDB openKeyCursor() returns primaryKeys in wrong order 2016-03-30
149585 DUPL Heavy LocalStorage use can cause page to freeze 2016-12-14
156125 INVA Fetching blob URLs with query parameters results in 404 2022-05-31
169851 FIXE Safari sends empty “Access-Control-Request-Headers” in preflight request 2017-03-22

Conclusion

I think cross-browser compatibility has improved a lot over the past few years. We have projects like Interop and Web Platform Tests, which make it a lot more streamlined for browser teams to figure out what’s broken and what they should prioritize.

So if you haven’t yet, there’s no better time to get started filing bugs on browsers! I’d recommend first searching for your issue in the right bug tracker (Chromium, Firefox, WebKit), then creating a minimal repro (CodePen, JSBin, plain HTML, etc.), and finally just including as much detail as you can (browser version, OS version, screenshots, etc.). I’d also recommend reading “How to file a good browser bug”.

Happy bug hunting!

Footnotes

1. Some folks have pointed out to me that rdar:// links can mean just about anything. I always assumed it meant that the bug got re-routed to some internal team, but I guess not.

Web component gotcha: constructor vs connectedCallback

A common mistake I see in web components is this:

class MyComponent extends HTMLElement {
  constructor() {
    super()
    setupLogic()
  }
  disconnectedCallback() {
    teardownLogic()
  }
}

This setupLogic() can be just about anything – subscribing to a store, setting up event listeners, etc. The teardownLogic() is designed to undo those things – unsubscribe from a store, remove event listeners, etc.

The problem is that constructor is called once, when the component is created. Whereas disconnectedCallback can be called multiple times, whenever the element is removed from the DOM.

The correct solution is to use connectedCallback instead of constructor:

class MyComponent extends HTMLElement {
  connectedCallback() {
    setupLogic()
  }
  disconnectedCallback() {
    teardownLogic()
  }
}

Unfortunately it’s really easy to mess this up and to not realize that you’ve done anything wrong. A lot of the time, a component is created once, inserted once, and removed once. So the difference between constructor and connectedCallback never reveals itself.

However, as soon as your consumer starts doing something complicated with your component, the problem rears its ugly head:

const component = new MyComponent()  // constructor

document.body.appendChild(component) // connectedCallback
document.body.removeChild(component) // disconnectedCallback

document.body.appendChild(component) // connectedCallback again!
document.body.removeChild(component) // disconnectedCallback again!

This can be really subtle. A JavaScript framework’s diffing algorithm might remove an element from a list and insert it into a different position in the list. If so: congratulations! You’ve been disconnected and reconnected.

Or you might call appendChild() on an element that’s already appended somewhere else. Technically, the DOM considers this a disconnect and a reconnect:

// Calls connectedCallback
containerOne.appendChild(component)

// Calls disconnectedCallback and connectedCallback
containerTwo.appendChild(component)

The bottom line is: if you’re doing something in disconnectedCallback, you should do the mirror logic in connectedCallback. If not, then it’s a subtle bug just lying in wait for the right moment to strike.

Note: See also “You’re (probably) using connectedCallback wrong” by Hawk Ticehurst, which offers similar advice.

2023 book review

A stack of books including many mentioned in this post like IQ84 and Pure Invention

Compared to previous years, my reading velocity has taken a bit of a nosedive. Blame videogames, maybe: I’ve put more hours into Civilization 6 than I care to admit, and I’m currently battling Moblins and Bokoblins in Zelda: Tears of the Kingdom.

I’ve also been trying to re-learn the guitar. I basically stopped playing for nearly a decade, but this year I was surprised to learn that it’s a lot like riding a bike: my fingers seem to know things that my brain thought I had forgotten. I’ve caught up on most of the songs I used to know, and I’m looking forward to learning more in 2024.

(The wonderful gametabs.net used to be my go-to source for great finger-picking-style videogame songs, but like a lot of relics of the old internet, its future seems to be in doubt. I may have to find something else.)

In any case! Here are the books:

Quick links

Fiction

Non-fiction

Fiction

A Wizard of Earthsea by Ursula K. Le Guin

One of those classics of fantasy literature that I had never gotten around to reading. I really enjoyed this one, especially as it gave me a new appreciation for Patrick Rothfuss’s The Name of the Wind, which seems to draw heavily from the themes of Earthsea – in particular, the idea that knowing the “true name” of something gives you power over it. I gave the second Earthsea book a shot, but haven’t gotten deep enough to get drawn in yet.

1Q84 by Haruki Murakami

I’ve always enjoyed Murakami’s dreamy, David Lynch-like magic realism. This one runs a little bit too long for my taste – it starts off strong and starts to drag near the end – but I still thoroughly enjoyed it.

Dare to Know by James Kennedy

This one was a bit of a sleeper hit which I was surprised to find wasn’t more popular. It’s a high-concept sci-fi / dystopian novel with a lot of fun mysteries and twists. I would be completely unsurprised if it gets turned into a Christopher Nolan movie in a few years.

Cloud Atlas by David Mitchell

This book has a big reputation, which I think is thoroughly earned. It’s best to read it without knowing anything about what it’s about, so that you can really experience the whole voyage the author is trying to take you on here.

All I’ll say is that if you like sci-fi and aren’t intimidated by weird or archaic language, then this book is for you.

Non-fiction

The Intelligence Illusion by Baldur Bjarnason

Like Out of the Software Crisis last year, this book had a big impact on me. This book deepened my skepticism about the current wave of GenAI hype, although I do admit (like the author) that it still has some reasonable use cases.

Unfortunately I think a lot of people are jumping into the GenAI frenzy without reading sober analyses like these, so we’ll probably have to learn the hard way what the technology is good at and what it’s terrible at.

Pure Invention: How Japan Made the Modern World by Matt Alt

As a certified Japanophile nerd (I did admit I play videogame music, right?), this book was a fun read for me. It’s especially interesting to see Japan’s cultural exports (videogames, manga, etc.) from the perspective of their own home country. I admit I hadn’t thought much about how things like Gundam or Pokémon were perceived by fans back home, so this book gave me a better context for the artifacts that shaped my childhood.

Creative Selection: Inside Apple’s Design Process During the Golden Age of Steve Jobs by Ken Kocienda

Yes, there is some hero-worship of Steve Jobs here, but there is also just a really engrossing story of great engineers doing great work at the right place in the right time. I especially loved the bits about how the original iPhone soft keyboard was designed, and how WebKit was initially chosen as the browser engine for Safari.

Fifty Plants that Changed the Course of History by Bill Laws

I’ve always been one of those pedants who loves to point out that most staples of European cuisine (pizza in Italy, fish and chips in Britain) are really foreign imports, since things like tomatoes and potatoes are New World plants. So this book was perfect for me. It’s also a fun read since it’s full of great illustrations, and gives just the right amount of detail – only the barest overview of how the plants were discovered, how they were popularized, and how they’re used today.